After reviewing the North division and analyzing how the Oilers did head-to-head against each Canadian team, I was curious to know how well the Oilers and Jets finished their regular seasons and what we could expect in their first round playoff series.
The Oilers results were obviously excellent, going 17-6-2 in their final 25 games for a 0.720 points percentage, while the Jets went 12-12-1. As we see in the table below, the Oilers success was largely driven by special teams in these final 25 games, as they posted a -5 goal differential at even-strength (5v5), a goal-share of only 47.47%. Note that the shot-share metrics (i.e., Corsi, Fenwick, Expected goals) have been score and venue adjusted.
Last 25 games, 5v5
Oilers
Jets
Points%
0.720
0.500
Corsi For%
48.13
49.46
Fenwick For%
47.37
49.29
xGoals For%
47.96
47.43
Goals For%
47.47
56.18
Shooting%
8.75
9.23
Save%
91.51
92.81
PDO
1.003
1.020
Thankfully the Oilers powerplay scored 21 goals, a rate of over 12.0 goals per hour over this final stretch, consistently generating shots and converting on their chances. And the penalty kill allowed only five goals, leading the league with a goals against rate of 2.90 per hour. Worth noting that the Oilers penalty kill gradually improved defensively, allowing league average rates of shots against over the final twenty five games, but still finished the year well above league average.
The Jets were a different story over their final twenty five games. They had excellent results at even-strength, posting a +11 goal differential (a 56.18% goal-share), and were closer to league average shot-share levels than the Oilers, gradually improving over the course of the year. They also had a little bump in their team shooting percentage – it’ll be interesting to see if they can carry some of that into the playoffs while missing some of their key players. The Jets goaltending was excellent all season at even-strength, and ended the year ranking as one of the best in the league – definitely expect that to be a major factor in the series.
Special teams is where the Jets broke-even to close the regular season. While they still scored 14 goals on the powerplay, a rate of 6.56 goals per hour that’s just under the league average rate, they allowed 13 on the penalty kill. Worth noting that the Oilers penalty kill will likely be tested as the Jets led the league in shots per hour on the powerplay over the final stretch of the season. The good news for Edmonton is that the Jets also allowed the third highest rate of shots against on their penalty kill. Not exactly where the Jets want to be against the Oilers powerplay, making it even more critical that they win the goal-share at even-strength and avoid bad penalties. The good news for the Jets is that they had the ninth lowest rate of penalties against in the regular season. Against the Oilers this year, they drew 28 penalties and were called for 26 – their best results against North division teams.
One other thing I wanted to see was how the players on each team did in terms of on-ice shot and goal differentials at even-strength (5v5) over the final twenty five games. Below are all of the Oilers skaters, sorted by their on-ice goal differential, with McDavid leading the way in all categories. We already know how poor the Oilers depth has been without McDavid on the ice, a problem that persisted all season. But it’s also a little concerning that Draisaitl, Nugent-Hopkins and Yamamoto – key top six players – each only had a +1 on-ice goal differential, and were posting lower than average shot differentials.
Defensively, I’d be a little concerned about the top pairing of Nurse and Barrie. While they both posted positive on-ice goal differentials, they ended the year with negative shot-differentials. Considering they spent so much time with McDavid, I would have expected their numbers to be a little better. Nice to see Kulikov posting good numbers just in case things fall apart for Nurse and Barrie. In ten games since being acquired by Edmonton, Kulikov has played 147 minutes with Larsson at even-strength, posting a Corsi For% of 57.28% and a goal-share of 65.95%. Bear should be getting regular minutes as well considering his solid on-ice shot-share numbers. And I can sort of understand why the coaching staff might be reluctant to play Jones or Russell and instead going with Koekkoek. Both players posted negative shot-differentials and goal-differentials to end the season.
Looking at the Jets skaters, there’s a few players including Scheifele and some of the third and fourth line options who were riding percentages to close the year. As noted above, goaltending was the driver and I think its safe to assume it’ll continue to be strong. Missing Ehlers and Dubois to start the series is going to hurt the Jets considering the team did so well controlling the flow of play with them on the ice. Dubois especially, if he gets healthy and plays, might see a market correction to his on-ice results considering he posted one of the lowest PDO’s on the team. It’ll be interesting to see what kind of match-ups happen and who gets assigned the McDavid minutes.
Should be an entertaining series and a lot closer than I think people are expecting. How much of the regular season carries over is anyone’s guess, but it will probably come down to how well the Oilers can play without McDavid on the ice at even-strength, the goaltending matchup between Hellebuyck and Smith and if the Jets can avoid getting burned on the powerplay. Looking forward to it!
This had to have been one of the most entertaining regular seasons in a long time. I’ll admit, I was completely fixated on the North division for obvious reasons, and totally lost track of the teams and players in other divisions. For me, every game had that nationally-televised feel, and being the race that it was in a condensed season, almost every match mattered.
And scoreboard-watching so often, it was an opportunity to learn more about the opposing teams, their players and performances, which definitely changed the regular season experience. Hopefully the league looks to integrate more of these multi-game series when regular seasons become regular again.
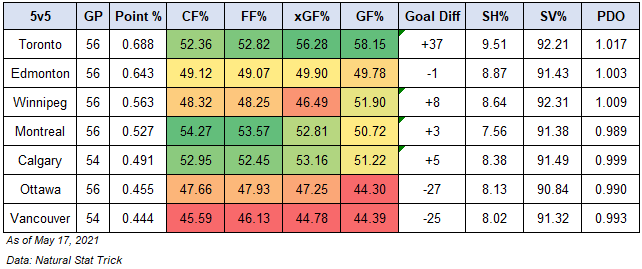
Here’s the final look at each team in the North division, and how well they performed at even-strength (5v5). As always, the table below is sorted by points percentage, with a basic heat map applied to the shot-share numbers and goal-share to see which teams did well, and whose results may have been influenced by player-driven outcomes (i.e., team shooting percentage and team save percentage). Note that the shot-share numbers (Corsi, Fenwick, Expected Goals) are always score and venue adjusted. A description of each metric is at the end of this article.
The Oilers are one of the rare teams to finish their season with a points percentage above 0.600 and have a 5v5 goal-share below 50.0% – only better than Ottawa and Vancouver in the North division. The annual top teams in the NHL have an average goal-share of 53.58%, with a Corsi For% and Expected Goals For% around 52.0%. The Oilers weren’t in that range, and as I wrote about a couple weeks ago, they rank quite low among all the other 2021 playoff teams. Regardless, they finished with one of their highest points percentages in franchise history thanks in large part to their franchise player and their success on special teams.
Metric (5v5)
Top Teams
League Average
Bottom Teams
Goals For%
53.58
50.01
46.72
Corsi For%
51.84
49.99
48.29
Expected Goals For%
51.72
50.01
47.86
The Oilers basically fell into that middle-of-the pack range for generating shots and scoring chances, close to where Ottawa and Vancouver ranked for some of the shot metrics. But they had the high-end talent to propel them to seventh in the league when it came to team shooting percentage, second only to the Leafs in the North, finishing with the tenth highest rate of goals-for in the league. Defensively, they were again in that middle-of-the-pack range, allowing shots and scoring chances at rates only slightly better than Winnipeg, Vancouver and Ottawa. And their goaltending finished 20th in the league, only ahead of Montreal, Vancouver and Ottawa. Toronto had the lowest rates of shots and scoring chances against, while the Jets finished with the best goaltending in the North and sixth-best in the league.
Head-to-head
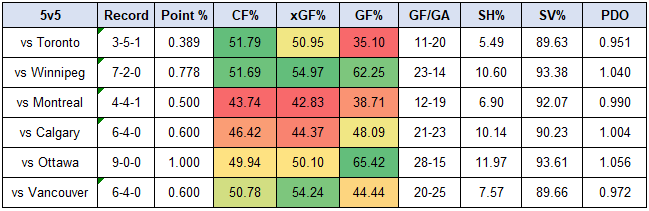
Seeing these overall results, I was curious to know who the Oilers had success against, and which teams they had issues with. Below are their numbers at even-strength (5v5) against each team, sorted by how their opponents finished in the North.
Remember, the Oilers finished with a -1 goal differential at even-strength this season, just a hair under a 50% goal-share, and shot metrics around that level as well (49.12% Corsi For%, 49.90% Expected Goals For%). When it came to actual results (i.e., goal-share), they did have the most trouble against the Leafs. But what might get overlooked is the fact that the Oilers actually played them pretty well as reflected by their share of shot attempts and scoring chances (again, these are score/venue adjusted). Similar results against Vancouver, of all teams. The Oilers appear to have run into some hot goaltending and couldn’t buy a save, as they generated a good share of shots, but finished with a -5 goal differential to end the season against the Canucks. The Oilers also had a negative goal-differential against Calgary and Montreal, which shouldn’t be too surprising considering they were out-shot and out-chanced in those matches.
What also stands out is the Oilers 104 PDO against the Jets, which is why I’m tempering my expectations just a little for the first round of the playoffs and expect the series to be a little closer than I think most are expecting. Remember, the Jets finished with one of the best save percentages in the league. If they can even have league average goaltending and maybe implement some of the tactics other North division teams used to slow down McDavid, they could be a lot more competitive in the playoffs. The other issue is that while the Oilers did well in terms of shot-shares against the Jets, it was, as we’ll see below, largely driven by McDavid.
Depth
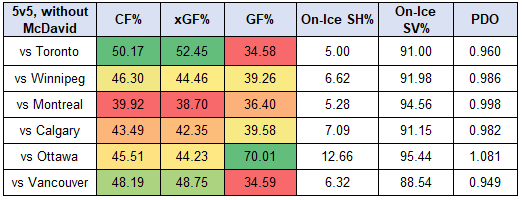
We know one of the ongoing issues for the Oilers is their even-strength play without McDavid on the ice. Here’s how the group did against each team, sorted by how their opponents ranked in the North division.
The Oilers without McDavid had a Corsi For% around 45.38% this season, and an Expected Goals For% of 45.18%. And they were out-scored 51-68, a goal-share of 42.86%. Using these as a baseline, we see that they struggled without McDavid against pretty much everyone, unable to post a goal-share above 40% against any team except for Ottawa. When it came to controlling the flow of play and scoring chances, they had the most issues against Montreal and Calgary. They couldn’t even muster much against Ottawa, but were able to take advantage of some poor goaltending. What’s interesting is that they did play a lot better against Toronto, but couldn’t convert on their chances enough. It’s clearly an area that management needs to address this off-season if they want to be competitive.
Special teams
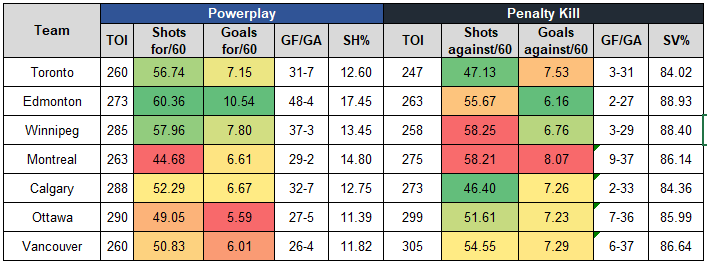
Here’s how each of North division teams did on the powerplay and penalty kill this season. Table is sorted by their overall results in the standings.
The Oilers once again had an excellent powerplay, scoring 48 goals, ranking first in the league in terms of goals per hour (10.54) and second in terms of shots per hour (60.36) only behind Colorado. Note that the average rate of shots per hour is typically around 53.0, with the average rate of goals per hour is around 7.0. The Oilers penalty kill results were excellent as well, finishing with the best rate of goals against in the North, good for ninth in the league. Their shorthanded success was largely due to their goaltending, as they allowed the eighth highest rate of shots against, only better than Winnipeg and Montreal in the North.
Toronto’s an interesting team – their powerplay was looking good early on in the season for similar reasons as Edmonton. They continued generating shots throughout the year, but things just cooled off. Their penalty kill was great suppressing chances as well, but didn’t get league average goaltending and finished 22nd in the league. Wonder how Calgary and Montreal are feeling about their special teams. Both clubs had positive goal differentials at even-strength, but were sunk by their power play and penalty kill results.
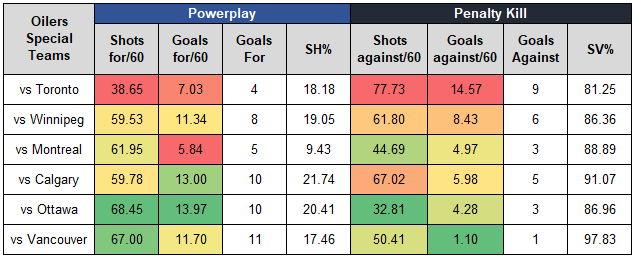
Back to Edmonton – they scored 48 goals on the powerplay with 31 of those against the non-playoff teams, so about 69% (nice). Toronto did a pretty solid job shutting the Oilers powerplay down, only allowing 38.65 shots against per hour (much lower than the 60.36 shots-for the Oilers averaged all season) and only allowing four goals against. Montreal had similar success against the Oilers powerplay, only allowing five goals, but it was mostly their goaltending that bailed them out. Looking at the Oilers rates of shots-for per hour, the Oilers did a pretty good job against everyone except for the Leafs.
The Oilers penalty kill also had issues against Toronto, allowing their highest rates of shots and goals against per hour. Again the Oilers had their most success on the penalty kill against the lower end teams, with 20 of the 27 total goals against being scored by the playoff teams (about 74%). Worth noting too that the Jets generated a pretty good rate of shots against the Oilers penalty kill, something worth watching in their upcoming series.
Summary
The Oilers were an average team at even-strength (5v5). They had a negative goal-differential against every North division team except Winnipeg and Ottawa.
The Oilers without McDavid were pretty much owned by every team in the North, posting a goal-share below 40% against each club except for Ottawa.
The Oilers powerplay was excellent, generating lots of shots against every team except for Toronto. The Leafs and Habs allowed the lowest rate of goals against versus Edmonton. The Oilers powerplay scored 69% of their powerplay goals against non-playoff teams.
The Oilers penalty kill was excellent, largely due to their goaltending. The Leafs and Jets powerplay had the most success against the Oilers. 74% of the Oilers goals against on the penalty kill were scored by playoff teams.
One final thought. I get that it’s hard to complain about the overall results this season considering their in the playoffs, but it’s definitely worth knowing where the team excelled and where they had issues. Knowing how critical the next off-season is, it’ll be important to address the problems that might be getting masked by the overall success, such as the 5v5 play, the depth scoring without McDavid on the ice, and even the penalty kill which again allowed a high rate of shots against. The last thing the Oilers can afford are shoddy roster decisions that hamper the chances of winning games and long-term success – especially in the McDavid era.
Points-percentage (Point%) – The total points accumulated divided by the points that were available, including extra time.
Corsi For percentage (CF%) – The proportion of all the shot attempts the team generated and allowed that the team generated (i.e., Corsi For/(Corsi For + Corsi Against). This is used as a proxy for possession and is the best at predicting a team’s future share of goals (GF%). (Source: Hockey Great Tapes – Draglikepull)
Fenwick For percentage (FF%) – The proportion of all the unblocked shot attempts the team generated and allowed that the team generated (i.e., Fenwick For/(Fenwick For + Fenwick Against). This is used as a proxy for shot quality and considers shot blocking a repeatable skill.
Expected Goals For percentage (xGF%) – This is a weighting placed on every unblocked shot based on the probability of the shot becoming a goal. This depends on the type of shot, location and uses historical shot and goals data to come up with the probability for each unblocked shot.
Goals For percentage (GF%) – The proportion of all the goals that the team scored and allowed that the team generated (i.e., Goals For/(Goals For + Goals Against).
Shooting percentage (SH%) – The percentage of the team’s shots on goal that became goals (i.e., total goals divided by the total shots on goal).
Save percentage (SV%) – The percentage of the team’s shots on goal against that were saved (i.e., 1-(totals goals allowed divided by the total shots on goal against)
While there were signs of life during the regular season, the Oilers results without McDavid on the ice at even-strength (5v5) were once again poor.
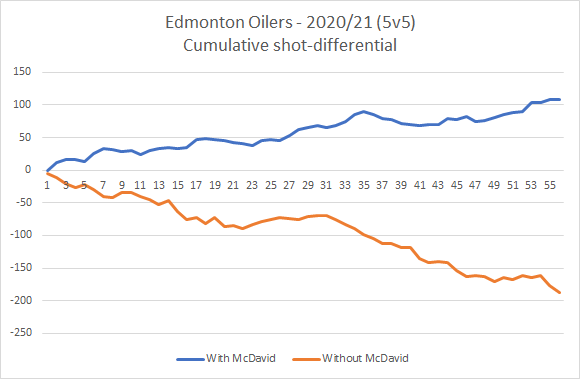
With McDavid deployed, the Oilers outscored opponents 64-48, an elite level goal-share of 57.14%. He typically plays for about 35% of the team’s total time, within which the Oilers tend to out-shoot and out-chance opponents, spending longer periods of time with the puck in the offensive zone. Without him, for about 65% of the total time, the Oilers were outscored 51-68, a goal-share of 42.86% – similar to what Detroit, Columbus and Buffalo finished their seasons with.
A big reason why the Oilers were outscored so badly without McDavid was because they were regularly out-shot and out-chanced. They posted a Corsi For percentage of 45.38% and an Expected Goals For percentage of 45.18% (score-adjusted), which was actually the lowest numbers posted in the McDavid era. And it was really on the offensive side of things where the club struggled. While their rates of shots against and goals against were around league average without McDavid on the ice, their rates of shots-for and goals-for were worse than the bottom-feeders of the league.
There was a point in the season where the Oilers shot-share numbers and goal-differential without McDavid at even-strength was starting to improve thanks to some roster adjustments and the improved defensive play of the club. But as we see below, things really went downhill from about the middle of the season. Over the final 25 games of the year, the Oilers were regularly outshot and getting outscored 15-28 (a 34.88% goal-share) – making it difficult to have much confidence in the club’s depth heading into the playoffs.
Thankfully, McDavid went absolutely supernova in his pursuit of 100-points to close out the season and bailed out the roster, but it should be yet another warning sign for management that they need to do a better job of identifying talent and building a stronger roster around their star player. It’s been a problem that the franchise has struggled with since McDavid’s arrival, not even once being able to reach the 50.0% break even-mark for goals and shot metrics without him on the ice. As mentioned above, this season the Oilers depth posted their worst shot-share numbers (i.e., Corsi For% and Expected Goals For%, score-adjusted) in the McDavid era.
As I’ve written in the past, measuring the team without McDavid is a pretty good way to evaluate the general manager’s work. We know McDavid is going to be dominant when he’s on the ice. But can Holland and his management group figure out how to build a roster that can get positive results, even break-even results, when he’s on the bench? The best teams in the league have figured it out, why can’t the Oilers?
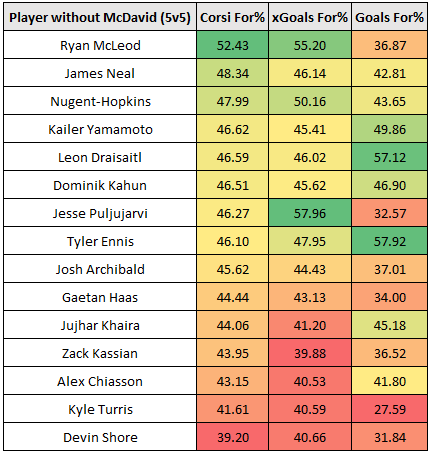
Right now the issue comes down to proper roster evaluation and construction. Taking a look at the forwards who played at least 100 minutes this season, and what their numbers were like without McDavid on the ice with them, it becomes apparent that it’s the professional-level players that management has trouble identifying and acquiring to surround their internally developed players with.
This table sorts all of the forwards by their on-ice Corsi For percentage, with a heat map applied. Keep in mind, 45.0% is the team average Corsi For% without McDavid on the ice. What stands out are the players with shot-share metrics in the red, as all of them except one are professional players that Holland either acquired or re-signed to new contracts. Some of these players even spent time with McDavid over the last couple of seasons, but weren’t productive enough to stay in the top six.
The main takeaway from all of this is that McDavid has yet to have a strong supporting cast around him, and the blame falls squarely on management, the professional scouting department and the teams’ evaluation and decision making processes. The fact that these professional-level players spent more time without the puck and getting out-chanced – and out-scored this badly – should be driving change within the organization.
The Oilers desperately need to figure this out ahead of what should be a busy off-season. The ability to identify talent that can drive offence to replace those that can’t is paramount if the Oilers want to build a championship contender. It’s great the Oilers are in a playoff spot and the potential is there for them to win a couple rounds. But until they figure out how to properly construct a roster, their success is unlikely to be sustainable.
Something I’ve been tracking this season is how close the Oilers are to being a top team in the league.
The good news so far is that their results have them in that range. A 0.600+ points percentage is what the top ten teams in the league often finish their regular season with, and the Oilers are there ranking 12th in the league and 2nd in the North with a 0.633 points percentage.
The issue is that while the results have been great, their underlying numbers – things like goal-share, Corsi For% and Expected Goals For% – are below what top teams have posted on average in the past.
What I had done before the season began was look at the top teams from the past few seasons and determine what the average numbers were for this group (Source). I also looked at what the league average levels were as well as what the lower quality teams had posted. Nothing overly scientific, but I got some basic thresholds to measure the Oilers against, and really get a sense for if the team is real or not. It was also something I wanted to keep in mind around trade deadline time to gauge if the team should be all-in or not for the playoffs.
Metric (5v5)
Top Teams
League Average
Bottom Teams
Goals For%
53.58
50.01
46.72
Corsi For%
51.84
49.99
48.29
Expected Goals For%
51.72
50.01
47.86
Using these thresholds, I found that after the first 25 games, the Oilers were great but they weren’t quite at the levels that top end teams post and they were hovering closer to leave average rates. And they’re still not quite there after 49 games.
But what about the other teams who have a points percentage above 0.600 this season? How well do those clubs compare against these thresholds.
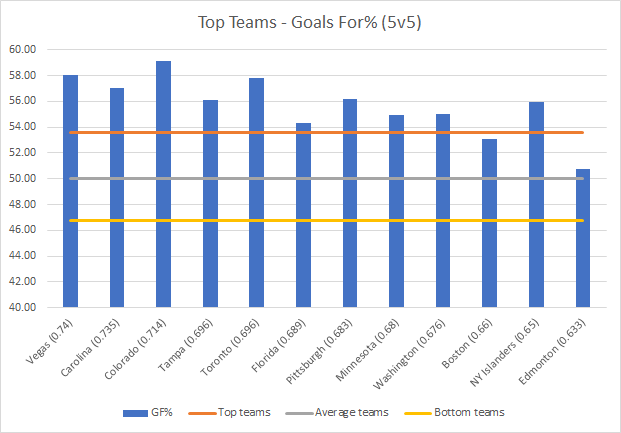
Lets start with goal-share. Below are the twelve teams that currently have a points percentage above 0.600 with their actual numbers in parentheses. I’ve added horizontal lines to represent the average goal-share for the top teams, average teams and bottom teams in the past. Here we see that ten of the twelve teams are where they should be, with Boston just missing the cut. The team that sticks out is Edmonton, who have barely broken even at even-strength (5v5), posting a goal-share of 50.76% and right around league average levels.
Here’s how the top team’s are doing in terms of Corsi For% this season. The Oilers are again rank near the bottom among this group, with Toronto closer to what previous top teams have posted. Not sure what’s happening in New York and Minnesota, but something to watch for in the playoffs.
And finally, here’s how the top teams are doing in terms of Expected Goals For%. The Oilers are closer to league average levels, but again, they rank near near the bottom among this group.
The point of all of this isn’t to ruin your day or diminish the Oilers chances of making a run in the playoffs. It’s really to emphasize that while the results have been great, the Oilers aren’t quite a top team just yet. It’s also information I would want to know as an owner before a manager blows millions of dollars on assets and to evaluate their overall work.
There’s a lot of work to be done in the off-season, a lot of roster issues to be addressed and it would be unfortunate if management fooled itself into thinking that they’re a piece or two away from being a long-term contender. I suspect that management is somewhat aware considering they didn’t make any major moves at the trade deadline. But they should be feeling pressure to get things right this coming off-season and do a better job than they did last off-season.
We discussed the Vancouver Canucks season, what the warning signs were coming off of a pretty good 2019/20 season and where things have gone wrong for the club. We discussed management’s approach to building the Canucks roster, what they’ll need to do differently to be competitive next year, and if Travis Green is the right coach for the team. Daniel also shared his thoughts on the key prospects for the team and the potential roles they could play.
Joined by Zach Laing (@zjlaing), news director for OilersNation and the Nation Network to talk all things Oilers.
We talked about our experiences covering the Edmonton Oilers and how the league can reach more communities and improve the fan experience. We discussed the Oilers season, which players have been the key drivers and who we want to see more from. We also covered the upcoming off-season, how to approach Nugent-Hopkins’ contract and how the defence core could potentially look next year – with or without Adam Larsson.
Joined by Dennis King (@DKingBH) to talk Oilers, the trade deadline and the direction the club appears to be heading with Ken Holland as general manager. We looked at the current roster construction, where the deficiencies have been, and what we’re expecting to happen this coming off-season. We also looked at the North division, how the Oilers compare with the Leafs, Canadiens and Jets and how things could shake out in the playoffs.
Pretty packed show with lots of great insight from Dennis who even took some listener questions.
Ryan Batty (@ryan_batty) joined me on the podcast to talk Edmonton Oilers, the trade deadline activities and expectations for the Oilers in the North division as they head towards the playoffs.
We discussed the acquisition of Dmitry Kulikov, how it impacts the current roster and how he could potentially help the club. We also shared our thoughts on the current management group, their decision-making and their short term and long approach to building the roster.