/cdn.vox-cdn.com/uploads/chorus_image/image/68955575/usa_today_15704205.0.jpg)
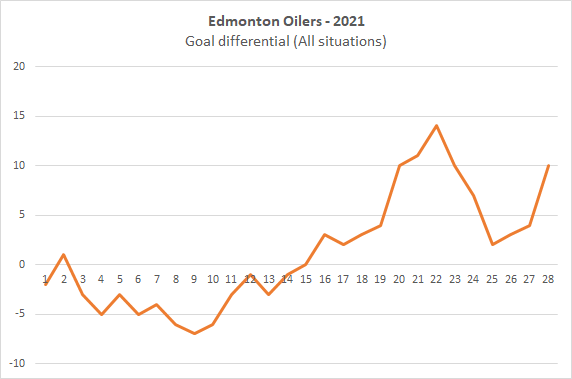
The Edmonton Oilers are half-way through this condensed season, sitting third in the North division with a points percentage of 0.607%, only behind Toronto and Winnipeg. It’s been a nice turnaround from the last time we checked in in early February when the Oilers ranked sixth in the division after 11 games and were struggling at even-strength and on the penalty kill.
| Team | GP | W | L | OTL | ROW | Points | Point % | Goal Diff |
| Toronto | 28 | 19 | 7 | 2 | 19 | 40 | 0.714 | +27 |
| Winnipeg | 26 | 16 | 8 | 2 | 16 | 34 | 0.654 | +11 |
| Edmonton | 28 | 17 | 11 | 0 | 17 | 34 | 0.607 | +10 |
| Montreal | 26 | 12 | 7 | 7 | 12 | 31 | 0.596 | +17 |
| Calgary | 27 | 12 | 12 | 3 | 11 | 27 | 0.500 | -8 |
| Vancouver | 30 | 12 | 16 | 2 | 10 | 26 | 0.433 | -17 |
| Ottawa | 29 | 9 | 19 | 1 | 7 | 19 | 0.328 | -40 |
The Oilers overall goal differential has gradually been improving as they’re getting better at controlling the flow of play, spending more time with the puck and getting better goaltending. In early February, they were allowing the third highest rate of goals against in the league, but now they’re closer to league average levels. And they’ve continued being one of the highest scoring teams in the league. They’re not quite at the levels posted by previous top-end teams, but they’re progressing well.
Quick glance into how the Oilers compare against their division rivals at even-strength (5v5). The table below is sorted by points percentage, with a basic heat map applied to the shot-share numbers to see which teams are doing well, and whose results may or may not be sustainable. Note that the shot-share numbers are score and venue adjusted. A description of each metric is at the end of this article.
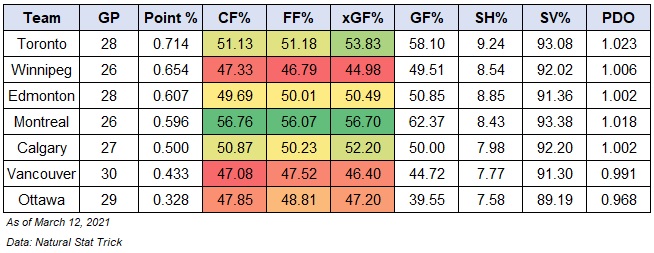
Nice to see the Oilers improve their Corsi For% from 47.13% in early February to 49.69% today. What’s especially encouraging is that they’ve posted a 52.10% Corsi For% (score and venue adjusted) over their last ten games, which is closer to what top end teams typically finish their seasons with.
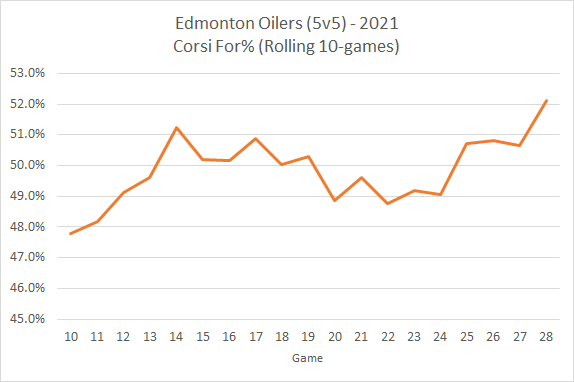
Worth noting that it’s been the improved play of the depth forwards that’s helped drive up the team’s shot share numbers. There were signs of progress recently, and it’s nice to see it continue. Without McDavid or Draisaitl on the ice over the last ten games, the Oilers have posted a Corsi For% of 52.56% as well as an Expected Goals For% of 51.07%. Unfortunately this hasn’t translated into an improved goal-share when depth forwards are on the ice, due to their team shooting percentage of 4.17%. Hopefully the Oilers are aware of the need for finishing talent, and can identify potential options – either internally or externally – to squeeze out better results.
As for the rest of the division, it’ll be interesting to see how Winnipeg does over the remaining stretch. They’re posting poor shot-share numbers at even-strength (5v5), allowing one of the highest rates of shots and scoring chances against in the league. And it doesn’t look like they’re riding a PDO wave, as their team shooting percentage and save percentage is around league average levels. Instead, it looks like they’re winning a lot of close games and doing alright on special teams as well, as their powerplay and penalty kill hasn’t been costing them games.
Below is a snapshot of how each North division team is doing on special teams. Starting with actual results, I’ve combined the goal rates for each team’s powerplay and penalty kill, also factoring in shorthanded goals. I’ve also combined the rate of unblocked shot attempts on each team’s powerplay and penalty kill, which can tell us if the team’s success on special teams is sustainable or not.
| Team | Combined goal rates | Combined unblocked shot rates |
| Toronto | 2.90 | 33.85 |
| Montreal | 1.53 | -8.51 |
| Edmonton | 1.45 | -3.65 |
| Winnipeg | 0.53 | -13.81 |
| Vancouver | -0.11 | 6.88 |
| Calgary | -0.91 | -11.53 |
| Ottawa | -4.84 | -2.10 |
For example, the Leafs have the best powerplay in the league and their penalty kill is slightly below league average. Combine the rate of goals for and against on the powerplay and penalty kill, you get 2.90. That’s not bad, but when you look at their combined rate of unblocked shots, you get a sense that there’s a chance that it gets better – especially on the penalty kill where they’re one of the best teams at preventing chances, but not able to get consistent goaltending. Considering their goaltending has been solid at even-strength, you have to wonder if it’s a matter of time before the Leafs start to improve on the penalty kill.
Edmonton is pretty much getting what they deserve on special teams. They’re doing well on the powerplay, generating lots of chances and getting positive results. On the penalty kill, they’re one of the worst at preventing chances, and their actual results are below league average. I suspect Winnipeg could see a hit to their special teams results as they’re breaking even right now, but allowing a high rate of shots on the penalty kill. Maybe goaltending bails them out, but it’s not exactly a recipe for long-term success. The other team to watch is Montreal. They’re getting great results at even-strength, but their special teams is over-performing relative to their underlying shot rates for and against. Prime opportunity for the Oilers to stay ahead of them in the standings as long as their play at even-strength continues to improve and their special teams doesn’t cost them games.
Data: Natural Stat Trick
Glossary:
- Points-percentage (Point%) – The total points accumulated divided by the points that were available, including extra time.
- Corsi For percentage (CF%) – The proportion of all the shot attempts the team generated and allowed that the team generated (i.e., Corsi For/(Corsi For + Corsi Against). This is used as a proxy for possession and is the best at predicting a team’s future share of goals (GF%). (Source: Hockey Great Tapes – Draglikepull)
- Fenwick For percentage (FF%) – The proportion of all the unblocked shot attempts the team generated and allowed that the team generated (i.e., Fenwick For/(Fenwick For + Fenwick Against). This is used as a proxy for shot quality and considers shot blocking a repeatable skill.
- Expected Goals For percentage (xGF%) – This is a weighting placed on every unblocked shot based on the probability of the shot becoming a goal. This depends on the type of shot, location and uses historical shot and goals data to come up with the probability for each unblocked shot.
- Goals For percentage (GF%) – The proportion of all the goals that the team scored and allowed that the team generated (i.e., Goals For/(Goals For + Goals Against).
- Shooting percentage (SH%) – The percentage of the team’s shots on goal that became goals (i.e., total goals divided by the total shots on goal).
- Save percentage (SV%) – The percentage of the team’s shots on goal against that were saved (i.e., 1-(totals goals allowed divided by the total shots on goal against)

Pingback: North division review | The SuperFan