This had to have been one of the most entertaining regular seasons in a long time. I’ll admit, I was completely fixated on the North division for obvious reasons, and totally lost track of the teams and players in other divisions. For me, every game had that nationally-televised feel, and being the race that it was in a condensed season, almost every match mattered.
And scoreboard-watching so often, it was an opportunity to learn more about the opposing teams, their players and performances, which definitely changed the regular season experience. Hopefully the league looks to integrate more of these multi-game series when regular seasons become regular again.
Here’s the final look at each team in the North division, and how well they performed at even-strength (5v5). As always, the table below is sorted by points percentage, with a basic heat map applied to the shot-share numbers and goal-share to see which teams did well, and whose results may have been influenced by player-driven outcomes (i.e., team shooting percentage and team save percentage). Note that the shot-share numbers (Corsi, Fenwick, Expected Goals) are always score and venue adjusted. A description of each metric is at the end of this article.
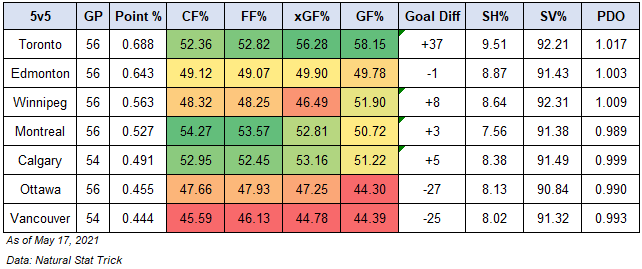
The Oilers are one of the rare teams to finish their season with a points percentage above 0.600 and have a 5v5 goal-share below 50.0% – only better than Ottawa and Vancouver in the North division. The annual top teams in the NHL have an average goal-share of 53.58%, with a Corsi For% and Expected Goals For% around 52.0%. The Oilers weren’t in that range, and as I wrote about a couple weeks ago, they rank quite low among all the other 2021 playoff teams. Regardless, they finished with one of their highest points percentages in franchise history thanks in large part to their franchise player and their success on special teams.
| Metric (5v5) | Top Teams | League Average | Bottom Teams |
| Goals For% | 53.58 | 50.01 | 46.72 |
| Corsi For% | 51.84 | 49.99 | 48.29 |
| Expected Goals For% | 51.72 | 50.01 | 47.86 |
The Oilers basically fell into that middle-of-the pack range for generating shots and scoring chances, close to where Ottawa and Vancouver ranked for some of the shot metrics. But they had the high-end talent to propel them to seventh in the league when it came to team shooting percentage, second only to the Leafs in the North, finishing with the tenth highest rate of goals-for in the league. Defensively, they were again in that middle-of-the-pack range, allowing shots and scoring chances at rates only slightly better than Winnipeg, Vancouver and Ottawa. And their goaltending finished 20th in the league, only ahead of Montreal, Vancouver and Ottawa. Toronto had the lowest rates of shots and scoring chances against, while the Jets finished with the best goaltending in the North and sixth-best in the league.
Head-to-head
Seeing these overall results, I was curious to know who the Oilers had success against, and which teams they had issues with. Below are their numbers at even-strength (5v5) against each team, sorted by how their opponents finished in the North.
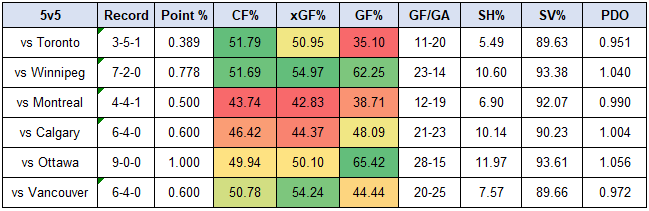
Remember, the Oilers finished with a -1 goal differential at even-strength this season, just a hair under a 50% goal-share, and shot metrics around that level as well (49.12% Corsi For%, 49.90% Expected Goals For%). When it came to actual results (i.e., goal-share), they did have the most trouble against the Leafs. But what might get overlooked is the fact that the Oilers actually played them pretty well as reflected by their share of shot attempts and scoring chances (again, these are score/venue adjusted). Similar results against Vancouver, of all teams. The Oilers appear to have run into some hot goaltending and couldn’t buy a save, as they generated a good share of shots, but finished with a -5 goal differential to end the season against the Canucks. The Oilers also had a negative goal-differential against Calgary and Montreal, which shouldn’t be too surprising considering they were out-shot and out-chanced in those matches.
What also stands out is the Oilers 104 PDO against the Jets, which is why I’m tempering my expectations just a little for the first round of the playoffs and expect the series to be a little closer than I think most are expecting. Remember, the Jets finished with one of the best save percentages in the league. If they can even have league average goaltending and maybe implement some of the tactics other North division teams used to slow down McDavid, they could be a lot more competitive in the playoffs. The other issue is that while the Oilers did well in terms of shot-shares against the Jets, it was, as we’ll see below, largely driven by McDavid.
Depth
We know one of the ongoing issues for the Oilers is their even-strength play without McDavid on the ice. Here’s how the group did against each team, sorted by how their opponents ranked in the North division.
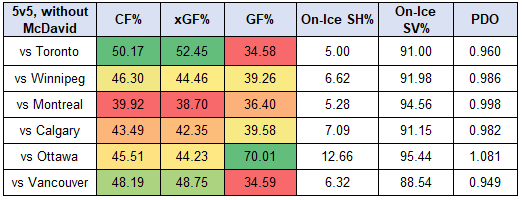
The Oilers without McDavid had a Corsi For% around 45.38% this season, and an Expected Goals For% of 45.18%. And they were out-scored 51-68, a goal-share of 42.86%. Using these as a baseline, we see that they struggled without McDavid against pretty much everyone, unable to post a goal-share above 40% against any team except for Ottawa. When it came to controlling the flow of play and scoring chances, they had the most issues against Montreal and Calgary. They couldn’t even muster much against Ottawa, but were able to take advantage of some poor goaltending. What’s interesting is that they did play a lot better against Toronto, but couldn’t convert on their chances enough. It’s clearly an area that management needs to address this off-season if they want to be competitive.
Special teams
Here’s how each of North division teams did on the powerplay and penalty kill this season. Table is sorted by their overall results in the standings.
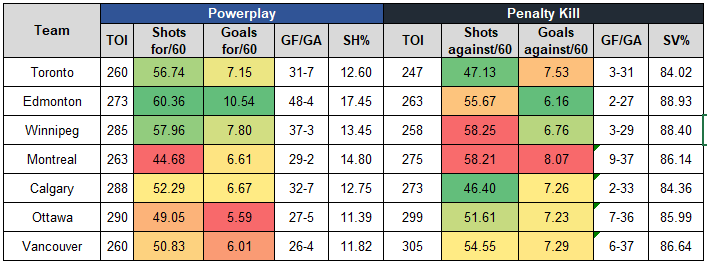
The Oilers once again had an excellent powerplay, scoring 48 goals, ranking first in the league in terms of goals per hour (10.54) and second in terms of shots per hour (60.36) only behind Colorado. Note that the average rate of shots per hour is typically around 53.0, with the average rate of goals per hour is around 7.0. The Oilers penalty kill results were excellent as well, finishing with the best rate of goals against in the North, good for ninth in the league. Their shorthanded success was largely due to their goaltending, as they allowed the eighth highest rate of shots against, only better than Winnipeg and Montreal in the North.
Toronto’s an interesting team – their powerplay was looking good early on in the season for similar reasons as Edmonton. They continued generating shots throughout the year, but things just cooled off. Their penalty kill was great suppressing chances as well, but didn’t get league average goaltending and finished 22nd in the league. Wonder how Calgary and Montreal are feeling about their special teams. Both clubs had positive goal differentials at even-strength, but were sunk by their power play and penalty kill results.
Back to Edmonton – they scored 48 goals on the powerplay with 31 of those against the non-playoff teams, so about 69% (nice). Toronto did a pretty solid job shutting the Oilers powerplay down, only allowing 38.65 shots against per hour (much lower than the 60.36 shots-for the Oilers averaged all season) and only allowing four goals against. Montreal had similar success against the Oilers powerplay, only allowing five goals, but it was mostly their goaltending that bailed them out. Looking at the Oilers rates of shots-for per hour, the Oilers did a pretty good job against everyone except for the Leafs.
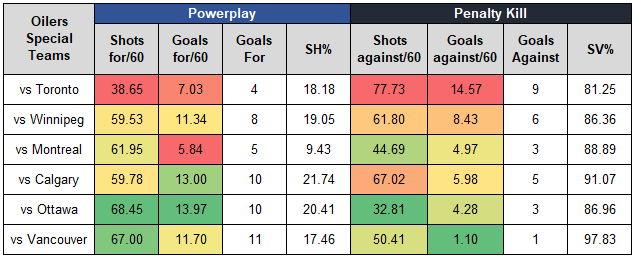
The Oilers penalty kill also had issues against Toronto, allowing their highest rates of shots and goals against per hour. Again the Oilers had their most success on the penalty kill against the lower end teams, with 20 of the 27 total goals against being scored by the playoff teams (about 74%). Worth noting too that the Jets generated a pretty good rate of shots against the Oilers penalty kill, something worth watching in their upcoming series.
Summary
- The Oilers were an average team at even-strength (5v5). They had a negative goal-differential against every North division team except Winnipeg and Ottawa.
- The Oilers without McDavid were pretty much owned by every team in the North, posting a goal-share below 40% against each club except for Ottawa.
- The Oilers powerplay was excellent, generating lots of shots against every team except for Toronto. The Leafs and Habs allowed the lowest rate of goals against versus Edmonton. The Oilers powerplay scored 69% of their powerplay goals against non-playoff teams.
- The Oilers penalty kill was excellent, largely due to their goaltending. The Leafs and Jets powerplay had the most success against the Oilers. 74% of the Oilers goals against on the penalty kill were scored by playoff teams.
One final thought. I get that it’s hard to complain about the overall results this season considering their in the playoffs, but it’s definitely worth knowing where the team excelled and where they had issues. Knowing how critical the next off-season is, it’ll be important to address the problems that might be getting masked by the overall success, such as the 5v5 play, the depth scoring without McDavid on the ice, and even the penalty kill which again allowed a high rate of shots against. The last thing the Oilers can afford are shoddy roster decisions that hamper the chances of winning games and long-term success – especially in the McDavid era.
Data: Natural Stat Trick, Hockey Reference
Related:
- Shallow depth – The SuperFan (2021, May 16)
- Tracking the top teams – The SuperFan (2021, May 3)
- Tracking the North division – The SuperFan (2021, March 12)
Glossary:
- Points-percentage (Point%) – The total points accumulated divided by the points that were available, including extra time.
- Corsi For percentage (CF%) – The proportion of all the shot attempts the team generated and allowed that the team generated (i.e., Corsi For/(Corsi For + Corsi Against). This is used as a proxy for possession and is the best at predicting a team’s future share of goals (GF%). (Source: Hockey Great Tapes – Draglikepull)
- Fenwick For percentage (FF%) – The proportion of all the unblocked shot attempts the team generated and allowed that the team generated (i.e., Fenwick For/(Fenwick For + Fenwick Against). This is used as a proxy for shot quality and considers shot blocking a repeatable skill.
- Expected Goals For percentage (xGF%) – This is a weighting placed on every unblocked shot based on the probability of the shot becoming a goal. This depends on the type of shot, location and uses historical shot and goals data to come up with the probability for each unblocked shot.
- Goals For percentage (GF%) – The proportion of all the goals that the team scored and allowed that the team generated (i.e., Goals For/(Goals For + Goals Against).
- Shooting percentage (SH%) – The percentage of the team’s shots on goal that became goals (i.e., total goals divided by the total shots on goal).
- Save percentage (SV%) – The percentage of the team’s shots on goal against that were saved (i.e., 1-(totals goals allowed divided by the total shots on goal against)

Pingback: Previewing the Oilers vs Jets | The SuperFan
Pingback: Reviewing the Oilers vs Jets | The SuperFan
Pingback: Vibe check | The SuperFan
Pingback: Tracking the Pacific division – As of October 31, 2021 | The SuperFan