Joined Jessica Ng on CBC Radio Active on Tuesday afternoon to talk Edmonton Oilers and all of the speculation around their coaching search underway. Full segment is here: CBC Radio Active (2026, June 9)
Topics we covered:
How the Oilers got to this point.
Some of the coaching options we’ve been hearing about.
Why Mike Babcock is a terrible, terrible option.
Big thank you as always to the amazing team at CBC Edmonton for putting the show together.
The Edmonton Oilers announced several front office changes today, including the addition of three new assistant general managers. There appears to be a bigger focus on the European market, player procurement, player development and innovation. As well as continued expansion of their analytics and technology department. The full news release is on the Oilers website.
These changes also tie well well into what I wrote about last week around strengthening the foundational pieces of the organization and the key strategies and enablers needed to keep the Oilers championship window open.
Every single issue the Oilers have – from goaltending, to team defence to poor roster construction to the penalty kill, etc. – these are all symptoms of much deeper systemic issues. Specifically, the issues around how the Oilers draft, develop, derisk and deploy players. And the organizational enablers for these strategies – the people, the technology and especially the governance around how decisions are made – these haven’t been great either. These core deficiencies contributed to a disappointing regular season and playoff run – and the changes today reflect an acknowledgement of that.
Oilers GM Stan Bowman also shared his thoughts on Oilers Now with Bob Stauffer shortly after the announcement and it’s worth a listen. Giving a rundown of the changes, Bowman did speak very highly of Michael Parkatti and his team and how the organization uses the tools and information that have been developed in-house. Good sign that the enablers are being strengthened and the growing influence of analytics. But Bowman did add this line, which caught my attention.
“The analytics alone are not the answer but scouting alone isn’t the answer either. You’ve got to blend them together. The more you can do that effectively, the more good decisions you’re going to make.”
No argument with the concept. Your decision-making process has to leverage as much information as possible. But it’s something I think Bowman is struggling with just based on some of the poor roster-construction decisions he’s made since arriving in Edmonton. The Jarry acquisition, the Trent Frederic extension, how the Blues offer-sheets went down – all of these decisions don’t appear to be grounded in data or more modern, deeper insights. These decisions among others all have a “gut-feel”, eye-test vibe to it and is something that the Oilers could eliminate with better decision-making governance.
It’s also critical that the Oilers look to strengthen their pro scouting team by adding people who have that eye for the game and evaluating player attributes, but also have a demonstrated understanding and appreciation of how data analytics fits into hockey analysis. Someone who can bridge the gap between, or blend them like Bowman mentioned today, to drive deeper collaboration between the two areas, eliminate biases, and to help drive insights for better decision-making.
And if this person has experience working as a pro scout in the NHL, maybe for a smart front office, like Carolina. Or has a history of demonstrating their deep knowledge of the Edmonton Oilers online using video breakdowns, or have been on my podcast. Probably worth giving them a call. Dennis King and Bruce Curlock were the first names that came to mind, yes, but I’m sure there are others.
If the Oilers are serious in wanting to blend analytics and pro scouting, it’s really not that hard to resolve.
Update:
Wanted to share some of the responses I’ve received after this article was posted.
Here’s what David Johnson posted on BlueSky. David has experience working in the NHL, and shared some great perspective on how scouting and analytics works in a front office.
“Integration of scouting and analytics has to come from the top. It can’t be delegated. If the top management doesn’t buy in to analytics it just won’t work no matter how many analytically inclined scouts you have.
The way to integrate scouting and analytics is the same way as integrating a new scout. Scouts don’t agree on everything. Think of disagreement as adding uncertainty to player evaluation. How upper management handles that additional uncertainty is critical.
Where do the scouts agree? Where do they disagree? Is where they disagree important to us? How does this impact the price we are willing to pay for the player (salary, acquisition cost)? Those are the questions upper management must ask when there is disagreement among scouts.
Now you bring yet another opinion, analytics, to the table. Analytics will agree with the scouts on many things, but will disagree on others. It doesn’t matter as much who is voicing those analytical opinions as much as whether upper management trusts that opinion.
Maybe an analytically inclined scout can better communicate analytic driven evaluations to other ‘hockey people’ and maybe that scout can better build trust but a lot of it comes more down to personality, experience and track record. Trust isn’t earned over night.
You need two things to build trust. First, an upper management team that is open minded and willing to listen to their analytics groups evaluations and an analytics group that is capable of earning that trust through good work, good communication and showing some ‘wins’. It takes time.”
After another disappointing post-season, there’s going to be plenty of focus on what went wrong this year for the Edmonton Oilers and the many mistakes that have led to zero cups in the Connor McDavid era. But the issues like the roster construction, the coaching, the tactics, the penalty kill, goaltending, and so forth – these are all symptoms of larger, systemic issues. And until the Oilers address the system, they’ll continue to cycle through the same problems – no matter who’s the general manager, behind the bench or on the roster.
If the goal is to become a consistent contender, not just a hopeful one, the organization needs to be clear on a small set of strategies it must do exceptionally well—year after year. From my own professional experience and time analyzing the game, I keep coming back to four:
Drafting well is obviously at the foundation of sustainable contenders. It’s about identifying players with playoff-caliber traits – think skating, skill, competitiveness, adaptability, or whatever shows a stronger correlation to winning games. Not every pick is going to be a superstar, but they have to eventually cover roles across your program (at the NHL level and minor leagues). Drafting well reduces uncertainty and helps create asset leverage.
Development is where potential becomes value. It’s about helping young players improve so they can fill important roles, but this also involves efficient evaluation to determine whether this player is “real” and on track or not. Getting this step right and translating information into team-friendly contracts gives an organization a massive competitive advantage.
Derisk is about supplementing the roster with reliable, interchangeable players who can help mitigate uncertainty. It protects against injuries, stalled development and the volatility that comes up in the regular season and playoffs. More importantly, it prevents panic decisions—the kind that led to long-term deals driven by reputation and urgency.
Deployment involves taking the previous three strategies and turning them into actual outcomes by leaning on solid coaching, tactics, and execution. Get the right players in the right roles, build the right combinations and be ready to adapt when things happen or new information emerges. Roles should be based on impact and strong evidence, not reputation.
In simple terms: Drafting creates options. Development creates information. Derisking manages uncertainty. And deployment converts the surplus into wins.
Now none of these strategies are possible without the right enablers, which I’ve summarized below. Strategy is only as good as the organization’s ability to execute it, and it’s critical that the Oilers get these right.
People: Teams that contend for championships prioritize strong judgment over historical reputation. Management, amateur and pro scouts, development staff, cap analysts, and coaches need to be aligned—especially at key decision points like the draft, trade deadlines, and contracts.
Technology and data: The right tools can help build your organizations knowledge and insights and reduces reliance on anecdotal evidence and recency bias. Think video, player tracking and the infrastructure behind it all. And data exists to reduce decision errors by identifying the metrics that matter (i.e., correlates to goals and wins), track development curves, define performance indicators and separate usage effects from results. It helps inform a team’s decision-making process.
Governance: This has to do with clarity on who decides, when and with what inputs. Think parameters and key guiding principles that you would want the front office to abide by to protect the organization from long term ramifications (like long term, buyout proof contracts for power forwards over thirty).
This framework of strategies and enablers doesn’t guarantee championships, but it does instill organizational discipline that (1) improves a team’s odds of winning and (2) correct things faster when things inevitably go wrong.
The Edmonton Oilers have been making progress in some areas of the framework. They have found ways to derisk through some trades and signings and have invested in data analytics and technology to support decision-making at the draft and trade deadlines. But the results suggest major inconsistencies across the rest of the framework. The front office has struggled to build a competitive roster around their star players – largely due to poor drafting and developing, panic signings and trades, and very risk-averse coaching. And this all then leads back to the same conversations about the Oilers off-season – goaltending, penalty kill, team defence, and so forth.
In the modern-day NHL, championships aren’t won by simply assembling talent and hoping for the best. They’re won by organizations that have a repeatable strategy—one that consistently creates value, manages risk, and adapts. For a team like the Edmonton Oilers, competing for championships year after year requires more than just elite stars; it requires strong organizational alignment, discipline, and process. And the Oilers need to address these systemic issues if they realistically want to get things back on track.
“We were an average team all year. (When you’re) an average team with high expectations, you’re going to be disappointed.”
That post-game comment from Connor McDavid is a pretty succinct summary of the Edmonton Oilers 2025/26 season.
Their regular season had mediocre results driven by mediocre process. Their final points percentage and goal-share was league average. And their underlying shot-share metrics that capture the team’s ability to control the flow of play and outchance opponents were well below what they were in previous seasons. But the wave of two appearances in the finals combined with having McDavid and Draisaitl on the game-one roster masked those warning signs and created a false sense of optimism heading into the playoffs.
First, a brief summary of the Oilers 2026 post-season run – or maybe we’ll just call it a light jog.
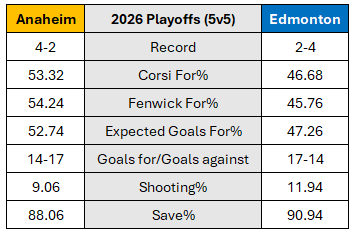
The Oilers did manage to outscore the Ducks at even-strength (5v5), but that was largely driven by a higher-than-normal shooting percentage of about 12 percent. The Oilers underlying numbers were unsurprisingly poor, as they only controlled 47 percent of the shot attempts and were often out-chanced as reflected by their Expected Goals for percentage of 47 percent. Put another way, the Oilers probably should have had a -2 goal differential instead of +3.
The powerplay was a bright spot for the team, scoring four times in only 22 minutes, a rate of 10.75 goals per hour, which aligns with their elite-level regular season results. Unfortunately, the refs didn’t call a lot of penalties in this series, which was bizarre and took away one of the Oilers edges in this series. But that’s just the usual post-season match fixing we all get to enjoy.
The Oilers penalty kill was a complete disaster, even getting called out by their captain last night. They allowed eight goals in only 21 minutes shorthanded – a rate of 22 goals against per hour, which is exceptionally high. And remember, this did not come out of nowhere. It was a problem all season and got even worse just before the playoffs began. This is going to be talked about for a long time as it pretty much cost them the series. Coaching, deployment and tactics will be under the microscope this off-season and I suspect a couple bad signings are going to be made to address this.
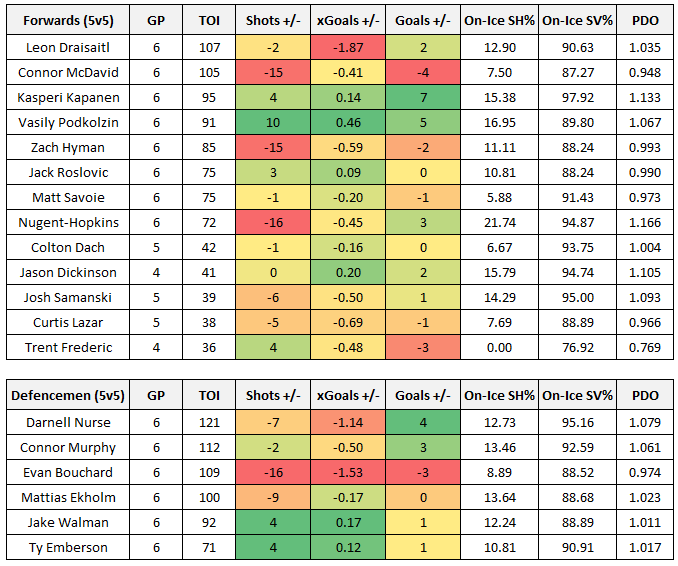
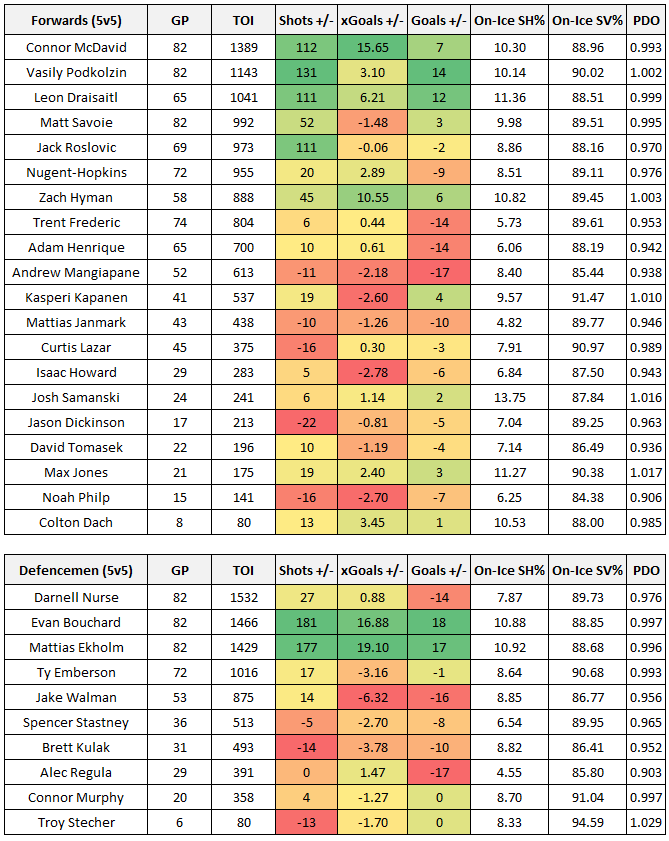
And here’s how the Oilers players did against the Ducks at even-strength (5v5), split by position and sorted by ice time, with a simple heat map applied to show how players compared to their teammates.
What stands out are the ghastly numbers posted by the Oilers top players. McDavid’s on-ice shot and scoring chance differentials were the worst in his playoff career and made him more of a liability rather than a driver. What was especially alarming was how bad McDavid and Draisaitl performed together. In 34 minutes together, they posted a 42 percent Corsi For percentage, and a 26 percent (!!) Expected Goals for percentage. It’s pretty obvious the two were injured, the coaching staff didn’t have a backup plan – and the Ducks exploited it. On the backend, Bouchard was pretty bad, spending a lot of time defending and only had three assists in the series. Darnell Nurse had another underwhelming postseason, offering little impact. And Ekholm was also looking pretty ordinary.
And now that they’ve been disposed of by the Ducks, the Oilers front office decision-makers are where they should be – focused on figuring out the real root causes of a disappointing regular season and reassessing whether its current approach is capable of sustaining championship contention. If Edmonton truly wants to be one of the top teams, that off-season work needs to go far deeper than blaming a short playoff run and just addressing the symptoms. This season was the result of many failings beyond the penalty kill, the coaching and the depth players. There’s a systemic issue here, and it needs to be figured out as soon as possible.
Quite the hole the Edmonton Oilers have dug themselves into, having now lost three straight games to the Anaheim Ducks. And unsurprisingly, the penalty kill sits at the center of the problem.
In my end‑of‑season post, I summarized the Oilers’ penalty kill as sketchy, and the numbers supported that. They finished the regular season with the 12th‑highest rate of goals against while short‑handed (8.16 per hour). That result was largely driven by poor underlying process – Edmonton allowed the ninth‑highest rate of shots against (54.64 per hour) and the ninth‑highest rate of expected goals against (9.57). Put another way, this team struggled to disrupt opposing power plays and consistently failed to keep the puck out of high‑danger areas.
Now that weakness has been fully exposed in the postseason—and things have gone from bad to worse, and could cost them another critical season. Through just 17 minutes of penalty‑kill time against the Ducks, the Oilers have surrendered six power‑play goals. That translates to a goals‑against rate north of 20(!) per hour. Once again, the underlying numbers tell the same story: a massive spike in shots against (89.83 per hour) and expected goals against (14.87 per hour). The Ducks are basically having no issues generating chances.
Worth noting that the penalty kill had been a recurring concern throughout the regular season, particularly after Adam Henrique went down with injury for an extended stretch. The 34‑year‑old centre was a significant contributor short‑handed, and his absence was felt. Now that he’s injured again, the drop‑off is even more pronounced.
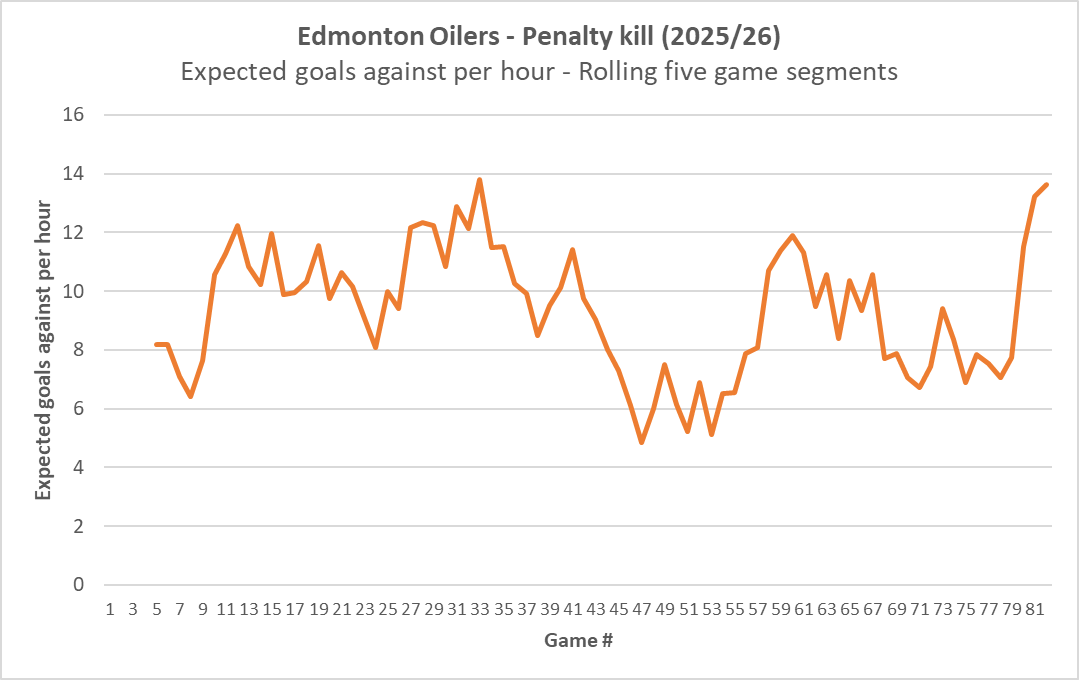
What I also didn’t realize was just how poorly the Oilers penalty kill performed late in the regular season, particularly in terms of the volume and quality of scoring chances allowed.
The chart below shows the Oilers’ expected goals against per hour on the penalty kill across the regular season, broken into rolling five‑game segments. The goal was to determine whether Edmonton had previously allowed scoring‑chance rates comparable to what we’re now seeing against Anaheim. I suspected they had—but I didn’t realize just how severe the spike was over the final few weeks of the season.
Given those trends, you’d expect the coaching staff to have been aware of this vulnerability heading into the playoffs. Either they weren’t aware of the data or they chose not to address it with urgency. Neither explanation reflects particularly well on any of them – specifically Knoblauch and Mark Stuart.
After seeing this data laid out, it’s hard to be completely surprised that the Oilers now find themselves down 3–1 in the series. What’s most alarming is that this feels entirely preventable—an issue that was clearly brewing long before game one of the post-season.
The Edmonton Oilers open their post-season on Monday night against the Anaheim Ducks and have a good chance of doing some damage at least in the first two rounds.
None of the teams in the Pacific were a significant threat in the regular season, with all five playoff-bound teams finishing between anywhere between 13th and 20th (!) overall in points percentage. It was pretty bad, but you have to appreciate the chaos it’s going to cause, especially with one of the better Central division teams being eliminated in the first round.
This Oilers first round matchup against the Ducks is pretty even for the most part. The Oilers did win the season series going 2-1 in three games, outscoring Anaheim 16-12. Edmonton did have a slight edge in shot-share metrics over those three games at even-strength, doing a slightly better job at controlling the flow of play (50.59% Corsi For percentage) and did generate a higher share of scoring chances (53.88% Expected Goals For percentage).
And as we saw in my last post, both teams were fairly close to one another in regular-season results as well as underlying shot-share numbers at even-strength. And both teams also had about the same level of goaltending – which was not very good. Even in the last twenty give games of the season, or since the Olympic break, both teams ranked near the bottom of the league. So it’s hard to say who has the real edge in net. Of the 66 goalies who played at least 20 games this season, Ingram ranked 40th with a 0.900 save percentage, while Dostal ranked 43rd with 0.899. Ingram also ranked 40th in goal-saved above average (GSAA) with -2.46, while Dostal ranked 45th with -6.67. Ingram has played fewer games this season than Dostal (32 compared to 46), which I think gives him a slight edge – but this area feels like a toss up.
One area Edmonton improved upon over the course of the season was overall defensive play at even-strength, specifically around preventing high danger scoring chances against. Prior to the Olympic break, the Oilers rate of expected goals against was 2.70, which ranked 23rd in the league. The team did shave this down to 2.40 after the Olympic break, which moved them into seventh best overall. Anaheim went the opposite direction. They were 27th overall with 2.79 expected goals against before the break, and dropped down to 30th after the break with 3.26.
The one area where the Oilers have a clear advantage over Anaheim is special teams. Edmonton finished the regular season with the best powerplay in the league and were consistently generating plenty of shots and scoring chances. Anaheim on the other hand ranked 23rd overall, with their rates of shots and chances ranking in the bottom third of the league. Anaheim, similar to Edmonton, did struggle killing penalties this season, allowing the seventh highest rate of goals against. While they did an okay job at preventing shots and chances, it was really their goaltending that let them down finishing 25th in team save percentage when shorthanded. Anaheim also took the sixth highest rate of penalties this season, so Edmonton should get some opportunities (unless of course the referees decide to do some match-fixing/”game management”). Seriously though, special team opportunities don’t happen often in the playoffs, especially as you get deeper into a series. But when they do happen, it’s typically in a high-stake situation, and the Oilers have demonstrated their ability to consistently take advantage.
Anaheim has plenty of talent, and I do still think their goaltending is better than it’s shown in the regular season. There’s also the issue of Edmonton’s depth issues and not doing so well when their elite players are on the bench. But the Oilers do have the edge with game-breaking talent and a cluster of players who have seen some things the last few seasons now. In a matchup where the margins are thin and the board looks pretty evenly set, that combination—along with elite special teams—may be enough to get Edmonton through to the next round.
The Edmonton Oilers 2025/26 regular season was a disappointing one as they finished with only 93 points – a 0.567 points percentage that ranked 14th in the league. Considering the previous five straight seasons of having a points percentage above 0.600, including four (kinda five) straight 100-pont seasons – this is definitely a drop off. But thanks to a weak conference, and especially a weak Pacific division where all five Pacific division playoff teams were below 0.600 and ranked 13th or lower in the league, the Oilers still managed to secure home ice advantage in the playoffs. Wild.
The Oilers lack of success was largely driven by their mediocre play at even-strength (5v5). Their -14 goal-differential and 48 percent goal-share ranked 20th in the league, which wasn’t surprising considering their Corsi For percentage barely broke even. Their share of scoring chances was a little better, and ranked in the top ten league-wide, but there was a noticeable drop off from previous seasons when they would be near the top of the league when it came to expected goal metrics.
That’s probably what’s the most troubling part about the Oilers regular season. Last year, they also had a negative goal differential at 5v5, but they were at least posting exceptional shot-share numbers, which meant the positive results were eventually going to come. This year however, it’s hard to have that same level of confidence, especially when you consider the team’s shot-share metrics are all around the 47 percent mark when McDavid or Draisaitl weren’t on the ice. The results have been just ghastly with the team posting a -31 goal differential when one of the glimmer twins aren’t deployed.
Here’s a quick look at the Oilers’ skaters, and their on-ice numbers sorted by ice time. Included is each player’s on-ice shot differential, expected goal differential and actual goal-differential. And for additional context, each player’s on-ice PDO is captured. A basic heat map is applied to show how players compare within their cohort. The key takeaway here is that the Oilers top six group is pretty good, and the rest are a bunch of blots ready to be exploited. Dickinson hasn’t been the solution for the bottom six group, and it’s hard to tell who can step up in the playoffs. The defence group has one solid pairing and the rest is a spot of bother.
The other factor to consider is the just-barely-average goaltending the Oilers are heading into the playoffs with – with Ingram taking the starter role. This is definitely an upgrade from previous seasons and bodes well for the team. But it’s a little concerning that the teams 5v5 save percentage was 88.84 percent (dead last in the league) over the course of the full season, and around the same mark over the final twenty-five games. Ingram just needs to be average, and Jarry should hopefully not see much ice time.
Quick notes on special teams. The Oilers powerplay finished the season as the league’s best, which is no surprise, scoring 11.88 goals per hour. This was largely driven by their high rate of shots and chances, which all ranked at the top. The penalty kill is where things are a little sketchy. The team finished 21st overall, allowing 8.16 goals against per hour. The team had trouble preventing shots and chances (all ranking in the bottom third of the league) and the goaltending was around league average levels. What’s interesting is that the team did do a better job at preventing shots at even-strength over the final stretch of the season, so it’s a little odd that this focus on defensive play didn’t translate to special teams.
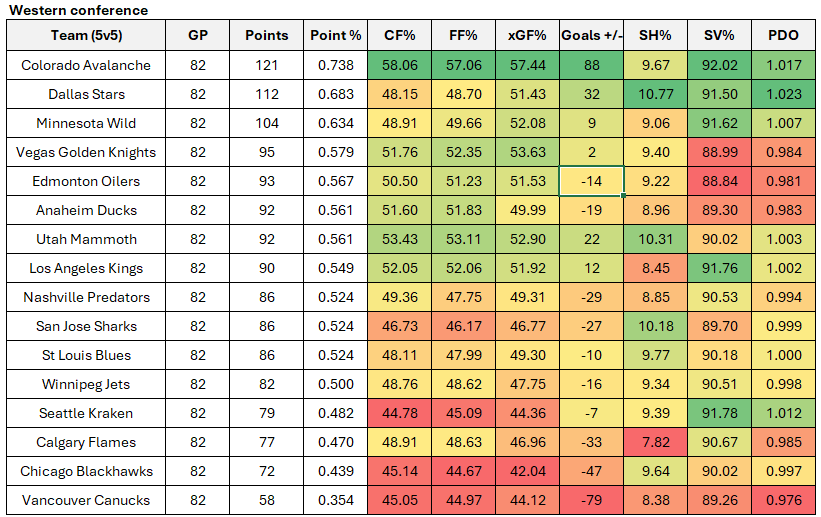
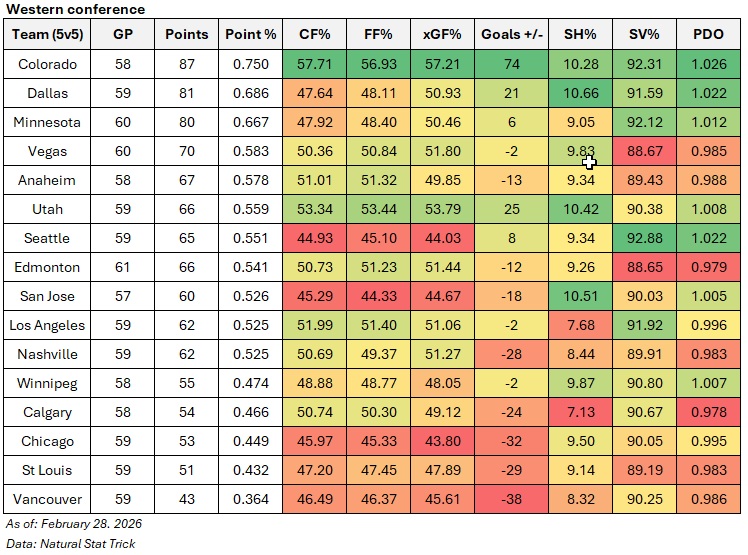
Below are the final even-strength (5v5) numbers for each team in the western conference (sorted by points percentage), including goal-differential results as well as the shot-share metrics that give us a sense of which teams have the right processes in place and if the results are sustainable or not. At the end of the table are each team’s shooting percentage and save percentage. I’ve also applied a basic heat map to each metric to show which teams are doing well or struggling relative to their conference foes (i.e., green is good, red is bad). You can also find a description of each metric at the end of this article. Please note that the shot-share metrics are score and venue adjusted based on Natural Stat Trick’s methodology.
Again, it was a giant, chaotic joke of a Pacific division/western conference/NHL. All five Pacific teams that made the playoffs had a lower points percentage than the Washington, who had the 12th best points percentage in the league (0.579), but still missed the playoffs. Los Angeles ranked 20th in the league with 0.549 and made it. Detroit, Long Island and Columbus all had better points percentages than Los Angeles and all missed the playoffs.
Vegas, Edmonton and Anaheim all had issues in net, so the results should probably have been better considering their ability to control the flow of play. What’s interesting is that over the course of the season, there wasn’t a lot of movement among the teams, and we had a good sense of who would make it pretty early on. The teams that did catch fire and media attention often fizzled out as their underling numbers were often poor. So there really wasn’t much excitement, especially with the Pacific being so, so bad.
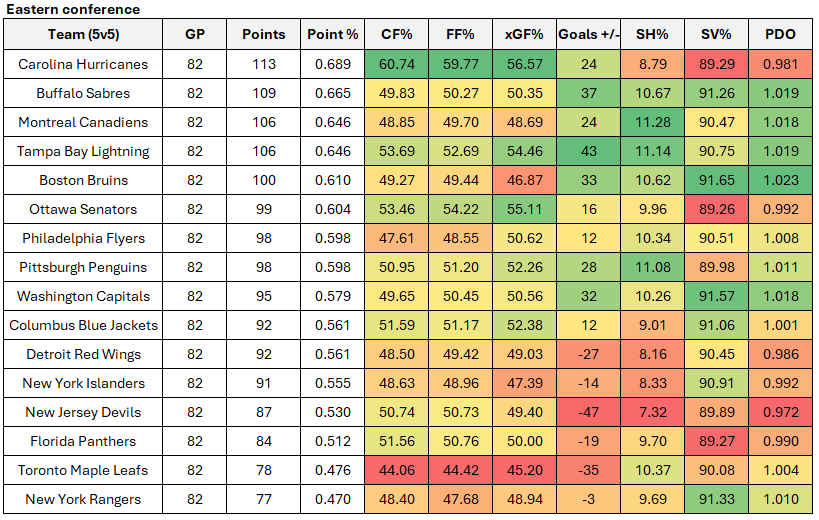
For reference, I’ve also put the table together for the eastern conference. Carolina, Tampa Bay and Ottawa all posted strong shot-share numbers, but it appears they’ve also had some goaltending issues. Buffalo obviously did well, but I do wonder if we see them struggle considering their shot-share numbers weren’t great and they rode the PDO pony a bit. Same with Montreal. Boston appears a little fraudulent, as does Philadelphia, so I don’t think they’ll get very far.
Obviously pulling for Edmonton because of the smart cats they have in the front office, but I’m thinking it’ll be Colorado coming out of the west and likely Carolina and Uncle Dennis representing the east.
Had the pleasure of joining Jessica Ng on CBC Radio Active on Friday afternoon to talk Oilers and how they’re somehow first in the Pacific division with three games to go. Full segment is here: CBC Radio Active (2026, April 10)
Topics we covered:
How the Oilers find themselves in first place, despite being a sub-600 points percentage team.
The Oilers injury issues.
Which teams are the ones to beat in the western conference and where the Oilers are lacking.
What a matchup with the Utah Mammoth could look like in the first round.
Other teams of note in the eastern conference, including Buffalo and Montreal.
Big thank you as always to the amazing team at CBC Edmonton for putting the show together. And for playing Rock the Bells!
Quick follow up to an article I wrote a few weeks ago when I looked into Adam Henrique’s struggles this season. I had found that while his even-strength numbers and overall productivity have predictably declined, he was at the time having a positive influence on the team’s penalty kill. And I speculated that the Oilers penalty kill would struggle without him.
Turned out I was correct, but not for the exact reasons I had based my prediction on.
In the first 43 games of the season with Henrique healthy, the Oilers penalty kill was fairly mediocre. They were sitting 17th in the league, allowing 7.52 goals against per hour. They were allowing a lot of shots and chances against, and the goaltending was actually decent, ranking 10th with an 86 percent save percentage. But with Henrique deployed, which was the most often among forwards, the rate of shots and goals against plummeted.
So his absence was fairly substantial, and the Oilers did see their penalty kill struggle severely without him. In those 15 games with Henrique unavailable, the Oilers allowed 13 goals against per hour (12 goals in 55 minutes) – one of the highest rates in the league and a big reason why the team struggled to bank some points. What’s interesting is that the team did an okay job preventing shots against. It was actually the goaltending that completely fell apart, posting a 76 percent save percentage.
I was also curious to see how Knoblauch and the coaching staff would spread Henrique’s penalty kill minutes among the forwards. Considering Knoblauch’s lack of overall creativity with deployment and tactics, I wasn’t expecting much.
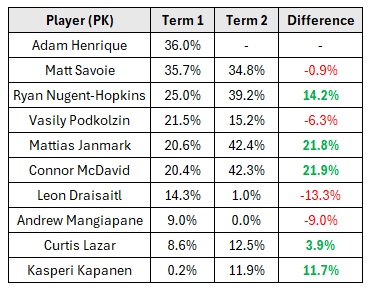
The table here lists all of the penalty killing forwards this season, sorted by their share of the total penalty kill time in the first term (the first 43 games when Henrique was healthy). Term two is the 15-game segment when Henrique was injured and unavailable. I’ve also added a column to capture the change in each players proportion in the second term compared to the first term.
So for example, Master Savoie played in 35.7 percent of the Oilers total penalty killing time when Henrique was healthy. In the second term, his total proportion slid slightly to 34.8 percent. There really was no reason to reduce his minutes considering the team does see fewer shots against when he’s out there – a great sign for the kid’s development.
The two forwards Knoblauch relied more on for the penalty kill was Janmark and McDavid. Janmark made sense as he has a lot of experience on the penalty kill and a safe bet for a risk-averse coach (even though the team sees way more shots and chances against with him on the ice). The significant increase in McDavid’s proportion of PK ice time is a little weird. Having him play the last bit of the penalty kill when the other team’s best forwards are getting a rest makes sense. But this many minutes at a real time of need reeks of panic and a lack of planning by the coaching staff. Would have preferred Podkolzin or Lazar getting more reps. Or even Mangiapane, but he’s clearly fallen out of favor with the coach.
Thankfully Henrique is back now and should help stabilize the penalty kill (and really that’s all he can do at this stage of his career). But the coaching staff, and the front office, should really have a plan in place just in case they need to move Henrique to improve the team’s depth’s performance at equal-strength.
Below are the even-strength (5v5) numbers for each team in the western conference (sorted by points percentage), including goal-differential results as well as the shot-share metrics that give us a sense of which teams have the right processes in place and if the results are sustainable or not. At the end of the table are each team’s shooting percentage and save percentage. I’ve also applied a basic heat map to each metric to show which teams are doing well or struggling relative to their conference foes (i.e., green is good, red is bad). You can also find a description of each metric at the end of this article. Please note that the shot-share metrics are score and venue adjusted based on Natural Stat Trick’s methodology.
.
Nothing else to add other than what I already posted here the other night. And no significant changes since my last western conference summary. The Pacific division is so weak right now, which makes the Oilers general malaise even more annoying. Like Vegas just got thrashed 5-0 against Pittsburgh this afternoon and Los Angeles just made another coaching change. Seattle and San Jose are phonies. And Calgary and Vancouver are, well, Calgary and Vancouver.
I know I just recently wrote about a more hybrid approach to the deadline, but it’s too tempting to just go all-in again when the path to the western conference finals looks pretty clear. The team did put Regula and Mangiapane on waivers this afternoon to get some flexibility, so something is definitely brewing.