Back in early September of 2025, I had identified Oilers veteran forward Adam Henrique as someone who could potentially see their ice time decrease to make room for some of the younger players.
This was because Henrique:
- had been seeing his point production decline;
- been negatively impacting his team’s ability to control shots and scoring chances at even-strength;
- hadn’t had a positive impact on the special teams, specifically the penalty kill, and
- was in the last year of his contract.
You can read the full article here: Depreciating assets (2025, September 13)
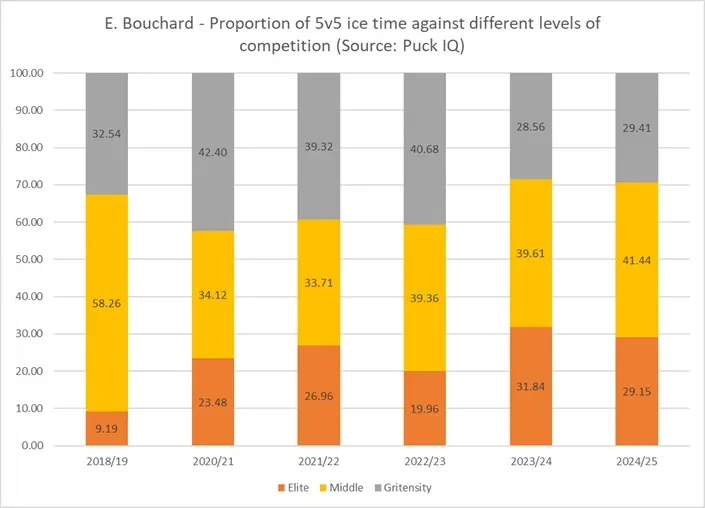
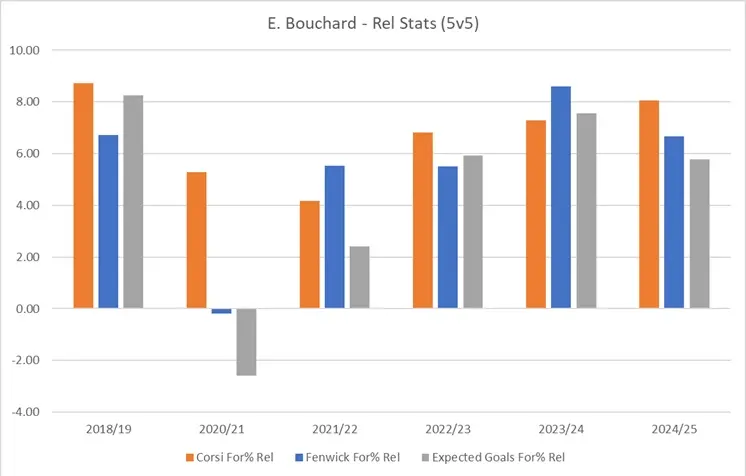
With the news that Henrique is being place on injured reserve and unavailable until after the Olympic break in late February, I wanted to see if his decline has continued this season based on the three areas I had originally focused on. And if the Oilers are better or worse without him in the lineup. He’s been a regular for the team this season, unlike some other veterans who have seen time in the press box despite having multi-season contracts.
Productivity at even-strength (five-on-five)
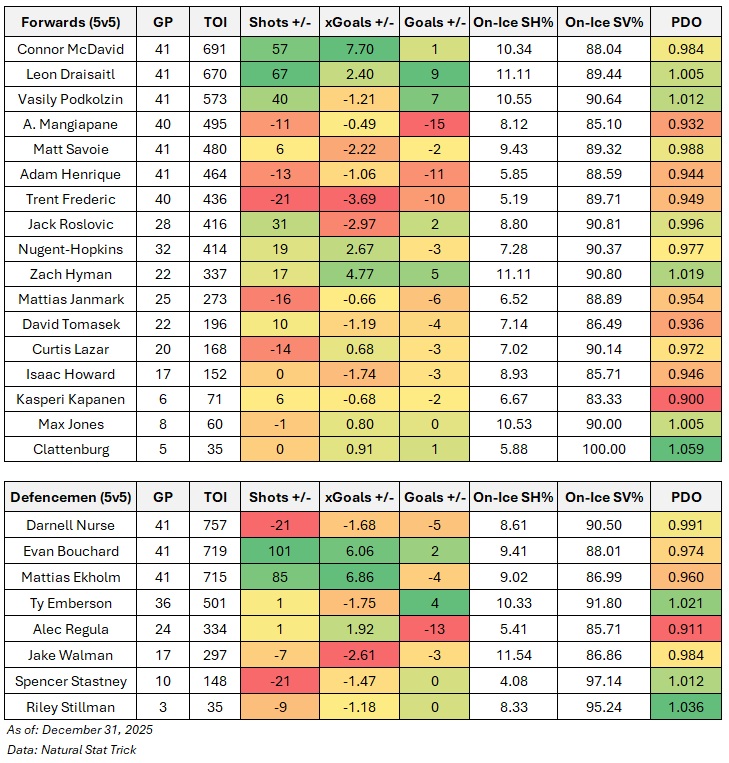
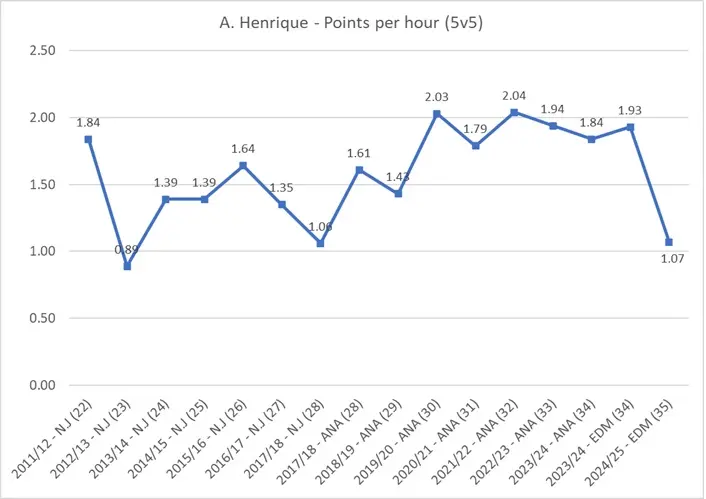
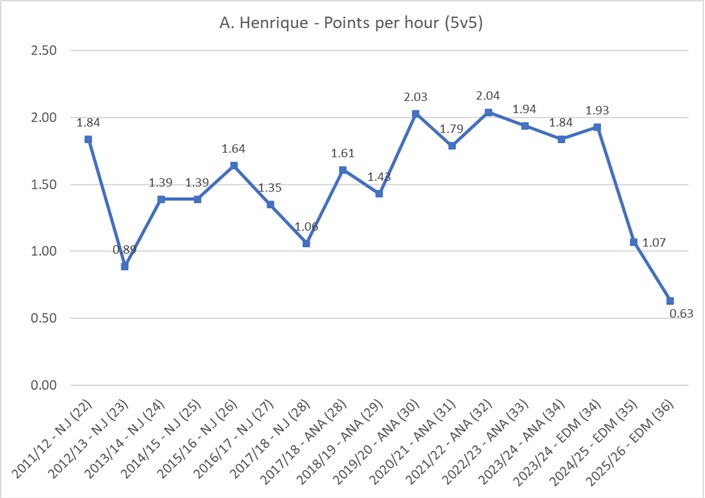
This season, Henrique has only one goal and four assists at even-strength (5v5) in a predominantly bottom-six role. That translates to only 0.63 points per hour, which is part of a continued decline for the 36 year old.
.
Henrique currently ranks 16th out of 17 Oiler forwards who have played at least 50 minutes, only ahead of Trent Frederic. This is beyond replacement-level production now.
Negative impact on the team’s even-strength performance
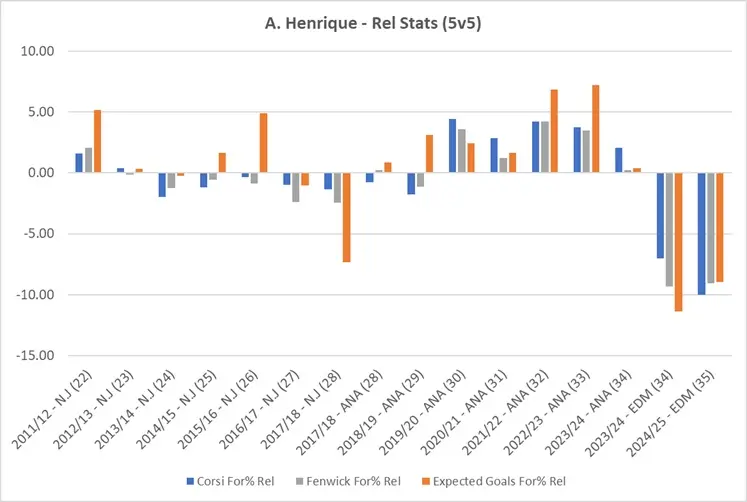
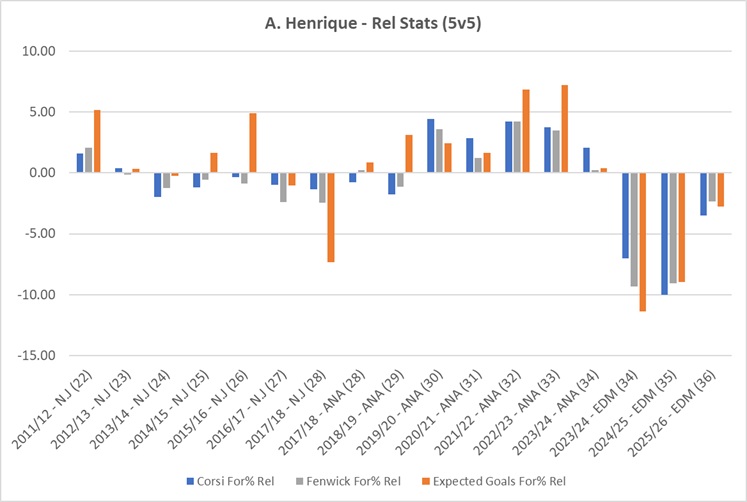
We saw over the last few seasons the negative impact Henrique would have on his team’s ability to control the flow of play and scoring chances. With him on the ice, the Oilers would spend more time without the puck and chasing the game, and almost every player on the team saw their on-ice numbers take a hit when Henrique was deployed with them.
.
This season Henrique has continued to have a negative impact on the team’s offensive opportunities, but it hasn’t been as bad as previous seasons. That’s progress, I guess. But it’s part of a continued downward trend, and hard to ignore. The entire bottom six group has been a dumpster this season at evens, and Henrique has been a major part of that.
- [Update] Worth noting that part of Henrique’s slide is the amount of time he’s played with Trent Frederic who is having a terrible season. Together, they’ve posted on-ice shot-share numbers below 44%, and when Frederic is away from Henrique, it’s not much better. But when Henrique is on the ice away from Frederic, his on-ice shot-share numbers are at or above 50 percent. Thanks to @gofortwoelks on BlueSky for the heads up!
Not so special on special teams
Okay, so here’s where things are a little interesting. The last few seasons, Henrique has not been great on the penalty kill with the team allowing a higher rate of shots against with him on the ice. This year, however, the Oilers actually see a drop in the rate of shots and chances against with Henrique deployed, which could explain why he’s leading the forward group in ice time on the penalty. And why he has a regular spot in the line up.
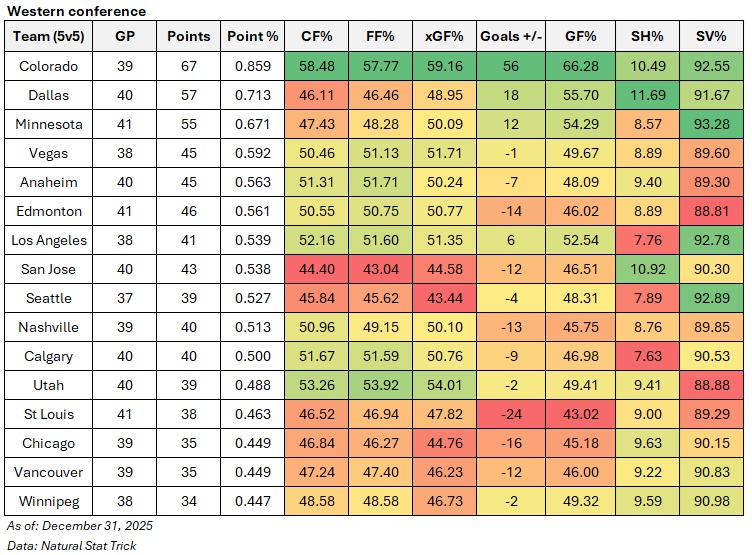
For context, the Oilers penalty kill ranks 17th in the league, allowing 7.52 goals against per hour. Main reason for the mediocre results: they allow the 11th highest rate of shots against per hour (56.21) and the eighth highest rate of unblocked shot attempts per hour (a proxy for scoring chances) with 85.07. The team’s goaltending has actually been decent, ranking 10th in the league with a 86.63 percent save percentage.
With Henrique on the ice for the penalty kill, the team allows a rate of 42.71 shots against per hour. Without him, this rate jumps by over 30 percent to 63.77 shots against per hour. That’s a significant difference, which should raise some concern for the team as they’ll need their penalty kill results to be strong – especially with the team struggling to outscore teams at even-strength. Right now, the Oilers have allowed 6.70 goals against per hour with Henrique out there, which is lower than the team rate, and significant lower than what Nugent-Hopkins is posting (12.08 goals against per hour, driven largely by a rate of 73.69 (!) shots against per hour). If RNH is taking on more penalty kill minutes, expect the results to get much worse.
So while the Oilers should be able to handle Henrique’s absence at even-strength, and will likely be better off without him in the lineup, the penalty kill performance and results are likely going to get worse.
Data: Natural Stat Trick