The Oilers have continued rolling along, ranked first in the Pacific division with 35 points and a 0.625% point percentage. Vancouver did actually have a better point percentage at the end of October, but struggled in November going 5-7-3, with a 0.433 point percentage (fifth worst in the league). The Oilers meanwhile posted a 0.571 point percentage (14th in the league), with division rivals San Jose (0.733) and Arizona (0.594) doing better.
- Related: Tracking the Pacific Division – As of October 31, 2019 – The SuperFan (2019, November 1)
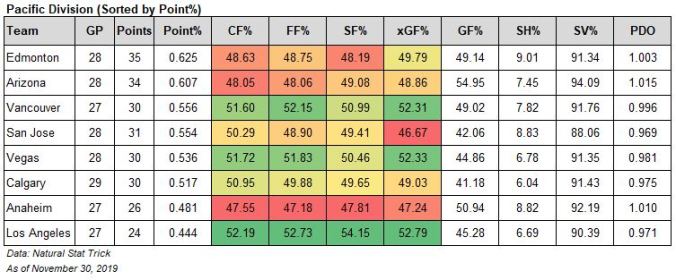
Below are the division results at even-strength (5v5) as of November 30, 2019, with teams sorted by point-percentage. For each of the shot-share metrics, I’ve applied a basic heat-map to show which teams are doing well compared to the division teams and which are struggling. A description of each metric is at the end of this article.
Couple thoughts:
- The big red-flag is the Oilers 49.14% goal-share (GF%) at even-strength. The good news: the rest of the Pacific division teams aren’t posting very good results at even-strength either, except Arizona. You can also see why some may feel that the Oilers should be all-in this season, potentially giving up future assets to make a playoff run in 2020.
- While the Oilers expected goal-share has remained steady since the end of October (49.87%), their Corsi For% and Fenwick For% has declined slightly, now sitting below 49.0%. I recently looked into the rolling 10-game trends, and found that it’s not all on the depth players this time. Good news is that they were showing signs of progress in terms of shot-share, but it remains to be seen if they can sustain it.
- Arizona is likely declining, as their Corsi For percentage in November was one of the worst in the league (44.63%, 29th overall), as well as their share of expected goals (44.67%). I don’t expect their goal-share to remain above 54%.
- I originally thought Vegas was the team to watch, and they still are considering their strong underlying numbers. But San Jose did make a nice bounce-back in November going 11-4-0, and gradually improving their Corsi For% from 47.96% at the end of October to 50.29% at the end of November. Their goaltending is what might holds them back as it remains one of the worst tandems in the league.
- Vancouver continues to do well in terms of shot-share, ranking 9th in the league when it comes to Corsi For% and 11th overall when it comes to expected goal-share. They lost some ground in November thanks to one of the worst team shooting percentages in the league. They’re probably due for a run.
- We know how good the Oilers have been on special teams, but it’s worth noting that the Golden Knights, Canucks and Sharks are excelling as well – all four Pacific division teams are in the top eight league-wide. Below are the Pacific division teams and their combined goal rates on the powerplay and penalty kill (i.e., PP GF/60 – PP GA/60 + PK GF/60 – PK GA/60). League average is near zero with Boston leading the way with +5.7. Los Angeles is third worst in the league (heh) only ahead of New Jersey (-4.97) and Detroit (-6.18).
| Team | Special Teams Combined Goal Rates |
| Edmonton | 5.08 |
| Vegas | 4.09 |
| Vancouver | 3.90 |
| San Jose | 3.26 |
| Arizona | -0.89 |
| Calgary | -1.27 |
| Anaheim | -4.17 |
| Los Angeles | -4.54 |
Data: Natural Stat Trick
Glossary:
- Points-percentage (Point%) – The total points accumulated divided by the points that were available, including extra time.
- Corsi For percentage (CF%) – The proportion of all the shot attempts the team generated and allowed that the team generated (i.e., Corsi For/(Corsi For + Corsi Against). This is used as a proxy for possession and can predict a team’s future share of goals (GF%).
- Fenwick For percentage (FF%) – The proportion of all the unblocked shot attempts the team generated and allowed that the team generated (i.e., Fenwick For/(Fenwick For + Fenwick Against). This is used as a proxy for shot quality and considers shot blocking a repeatable skill. It can also predict a team’s future share of goals, slightly better than Corsi.
- Shots For percentage (SF%) – The proportion of all the shots on goal that the team generated and allowed that the team generated (i.e., Shots For/(Shots For + Shots Against).
- Expected Goals For percentage (xGF%) – This is a weighting placed on every unblocked shot based on the probability of the shot becoming a goal. This depends on the type of shot, location and uses historical shot and goals data to come up with the probability for each unblocked shot. This has been found to be a better predictor of future goals than Corsi and Fenwick.
- Goals For percentage (GF%) – The proportion of all the goals that the team scored and allowed that the team generated (i.e., Goals For/(Goals For + Goals Against).
- Shooting percentage (SH%) – The percentage of the team’s shots on goal that became goals (i.e., total goals divided by the total shots on goal).
- Save percentage (SV%) – The percentage of the team’s shots on goal against that were saved (i.e., 1-(totals goals allowed divided by the total shots on goal against))
- PDO – The sum of a team’s shooting percentage (SH%) and its save percentage (SV%). It’s based on the theory that most teams will ultimately regress toward a sum of 100, and is often viewed as a proxy for how lucky a team is. (Source)

Pingback: Tracking the Pacific Division – As of December 31, 2019 | The SuperFan