
The Oilers had a lot of success in October, going 9-4-1 in the month and collecting 19 points in 14 games. They sit first overall in the Pacific based on points, but if you factor in the number of games played and the points available, they finished second in their division with a points-percentage of 0.679 behind only Vancouver.
Something I started doing last season was tracking how the Oilers compared with their division rivals at even-strength (5v5) on a month to month basis. Metrics like points, points-percentage and goal-share (GF%) at even-strength gives us a snapshot of the current results. And underlying shot-metrics like shot attempts and expected goals gives us a sense of which teams in the Pacific are for real, and which ones might have issues to address if they want to contend for a playoff spot.
Below are the results as of October 31, 2019, with teams sorted by points-percentage. For each of the shot-share metrics, I’ve applied a basic heat-map to show which teams are doing well compared to the division teams and which are struggling. A description of each metric is at the end of this article.

Couple thoughts:
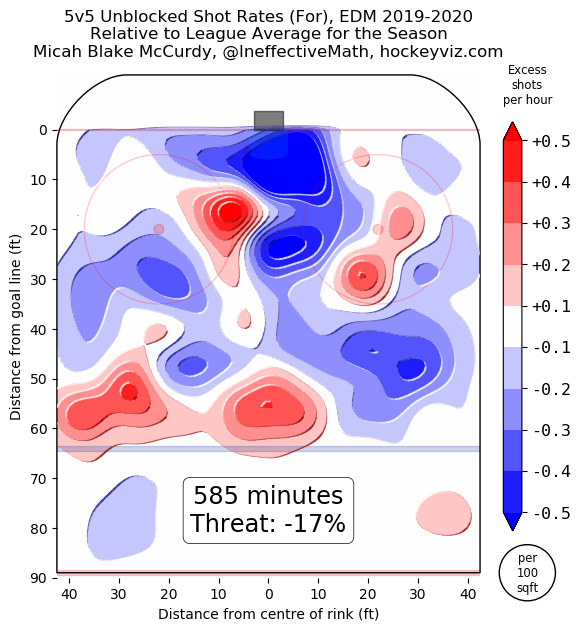
- It’s a little concerning that the Oilers possession numbers are poor relative to their division. The big problem is their offensive output, as they rank near the bottom of the league when it comes to shots and chances at even-strength. It’s a team-wide problem that hopefully gets addressed.
- The Oilers goal-share is right in line with their expected goal-share, which unfortunately is below 50%. Not many teams get into the playoffs with a negative goal-differential, but the fact that they have collected points puts them in a good spot to at least be contending for a playoff spot.
- I’m honestly surprised to see the Vancouver Canucks doing so well at even-strength and that they’re doing well when it comes to the underlying shot-share metrics. The Canucks powerplay is sitting at 12th overall in the league scoring 8.79 goals per hour. I suspect those results will improve considering that they’re top five in the league when it comes to shot attempts and scoring chances (i.e., Fenwick) per hour.
- I knew San Jose was struggling, but I did not realize how badly they were getting out-shot and out-chanced. It also doesn’t help that their goaltending has been poor, something that was an issue in years past but was masked by the team’s offensive output. Bright spot – their powerplay is generating a ton of shots and scoring chances on the powerplay, which ranks fifth in the league.
- Suspect Vegas will climb back into the top three of the Pacific by the end of 2019. They’re playing well as a team, but just haven’t converted on their chances. Their powerplay has been dynamite, scoring 10.34 goals per hour (4th in the league) and sitting near the top of the league when it comes to shots and chances.
- And here I thought the Oilers powerplay had an advantage over their division rivals. Vegas, Vancouver and San Jose are all top five in the league when it comes to shots and chances. Thankfully the Oilers aren’t too far behind them.
- Arizona is going to be the team to watch. Excellent shot-share numbers, but I’m not convinced that they have the finishing talent – similar to their story last season.
Data: Natural Stat Trick, Hockey Viz
Glossary:
- Points-percentage (Point%) – The total points accumulated divided by the points that were available, including extra time.
- Corsi For percentage (CF%) – The proportion of all the shot attempts the team generated and allowed that the team generated (i.e., Corsi For/(Corsi For + Corsi Against). This is used as a proxy for possession and can predict a team’s future share of goals (GF%).
- Fenwick For percentage (FF%) – The proportion of all the unblocked shot attempts the team generated and allowed that the team generated (i.e., Fenwick For/(Fenwick For + Fenwick Against). This is used as a proxy for shot quality and considers shot blocking a repeatable skill. It can also predict a team’s future share of goals, slightly better than Corsi.
- Shots For percentage (SF%) – The proportion of all the shots on goal that the team generated and allowed that the team generated (i.e., Shots For/(Shots For + Shots Against).
- Expected Goals For percentage (xGF%) – This is a weighting placed on every unblocked shot based on the probability of the shot becoming a goal. This depends on the type of shot, location and uses historical shot and goals data to come up with the probability for each unblocked shot. This has been found to be a better predictor of future goals than Corsi and Fenwick.
- Goals For percentage (GF%) – The proportion of all the goals that the team scored and allowed that the team generated (i.e., Goals For/(Goals For + Goals Against).
- Shooting percentage (SH%) – The percentage of the team’s shots on goal that became goals (i.e., total goals divided by the total shots on goal).
- Save percentage (SV%) – The percentage of the team’s shots on goal against that were saved (i.e., 1-(totals goals allowed divided by the total shots on goal against))
- PDO – The sum of a team’s shooting percentage (SH%) and its save percentage (SV%). It’s based on the theory that most teams will ultimately regress toward a sum of 100, and is often viewed as a proxy for how lucky a team is. (Source)

Pingback: Tracking the Pacific Division – As of November 30, 2019 | The SuperFan