After 11 games, the Oilers sit fourth in the Pacific Division with a 6-4-1 record and 13 points. Factoring in games played and extra time, the Oilers actually rank second in the division when it comes to points percentage, which is the points accumulated divided by the points that were available. It’s been an impressive month for the club as they’ve beaten some good teams and been competitive in most of their games.
Since the Oilers haven’t had a regular season game against any of their division rivals, it’s a good time to check in on the rest of the Pacific division to see how the other clubs are doing, what their strengths and weaknesses are, and what we could expect from them going forward.
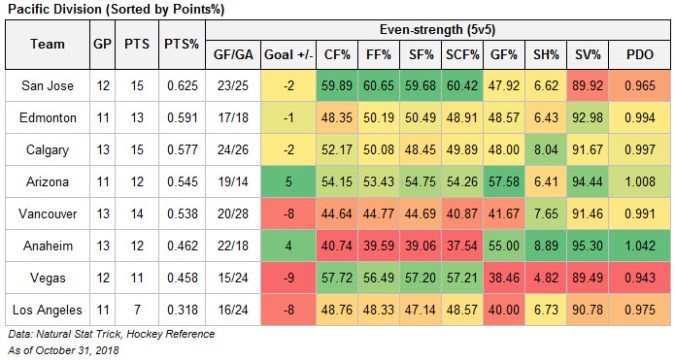
Below is a table containing the actual results for each team (i.e., points, points percentage), as well as the even-strength (5v5) numbers including shot-share metrics and goal-share. For context, I’ve also added each team’s even-strength shooting percentage and save percentage. For each metric, I’ve applied a basic heat-map to show which teams are doing well compared to the division teams and which are struggling. A description of each metric is at the end of this article.
Couple thoughts:
- The Oilers have a couple games in hand, which is why they rank higher in this table than the actual NHL standings. Points percentage is the way to go.
- The Oilers are doing alright when it comes to goaltending at even-strength. But their shooting percentage is just a hair below average. They currently rank 27th in the league and I think it has to do with (a) the lack of scoring talent on the wings and (b) the Oilers lack of opportunities from the high danger areas.
- Pacific Division teams are not doing well. The Sharks points percentage actually ranks sixth in the Western conference, with the Central teams leading the way. Of the bottom six teams in the West, five are from the Pacific.
- I’m surprised to see that the Sharks have a negative goal differential, and it’s thanks in large part to their 27th ranked team save percentage. Expectations are obvious high after acquiring Erik Karlsson and they’re doing everything they can to be a good possession team. But it’d be awful if goaltending, which actually ranked 28th in the league last season, is what drags them down. Curious to see if they enter the goalie market this year or in summer 2018.
- Arizona looks legit. They’re one of two Pacific division teams with a positive even-strength goal differential. I suspect they’ll start converting on their chances as they rank fifth in the league when it comes to generating high danger shot attempts. Challenge of course is finding the shooting talent to finish on those chances.
- If there’s anything that drags Arizona down, it’ll be their powerplay (5v4). They’re one of the worst in the league with only three powerplay goals, and rank in the bottom five when it comes to generating unblocked shot attempts and scoring chances.
- On the flip side, Arizona’s penalty kill (4v5) is top notch. One of the best in the league at preventing goals and scoring chances. Plus, they have five shorthanded goals and lead the league when it comes to generating shots and offensive opportunities shorthanded.
- I can’t imagine Anaheim finishing the season with a positive even-strength goal differential. They’re getting crushed when it comes to shot-share metrics and have been relying on John Gibson to bail them out.
- Looks like it’s going to be a long season for the Kings – they might already be out of the playoff race. Results have been poor and there really aren’t any underlying numbers you can hold on to.
- Vegas is the team I expect to make a bounce back, and at least compete for a playoff spot. Strong possession numbers and they’re in the top ten when it comes to high danger shot attempts. Curious to see if they do anything with their goaltending.
Any feedback, let me know. I’ll have an updated table at the end of November.
Data: Natural Stat Trick, Hockey Reference
Glossary:
- Points percentage (PTS%) – The total points accumulated divided by the points that were available, including extra time.
- Goals-for and Goals-against (GF/GA) – The number of goals scored and the number goals allowed at even-strength.
- Goal Differential (Goal +/-) – The difference between the goals scored and the number of goals allowed (i.e., goals-for minus goals-against)
- Corsi For percentage (CF%) – The proportion of all the shot attempts the team generated and allowed that the team generated (i.e., Corsi For/(Corsi For + Corsi Against). This is used as a proxy for possession and can predict a team’s future share of goals (GF%).
- Fenwick For percentage (FF%) – The proportion of all the unblocked shot attempts the team generated and allowed that the team generated (i.e., Fenwick For/(Fenwick For + Fenwick Against). This is used as a proxy for shot quality and considers shot blocking a repeatable skill. It can also predict a team’s future share of goals, slightlty better than Corsi.
- Shots For percentage (SF%) – The proportion of all the shots on goal that the team generated and allowed that the team generated (i.e., Shots For/(Shots For + Shots Against).
- Scoring Chances For percentage (SCF%) – The proportion of all the scoring chances that the team generated and allowed that the team generated (i.e., Scoring Chances For/(Scoring Chances For + Scoring Chances Against),
- Goals For percentage (GF%) – The proportion of all the goals that the team scored and allowed that the team generated (i.e., Goals For/(Goals For + Goals Against).
- Shooting percentage (SH%) – The percentage of the team’s shots on goal that became goals (i.e., total goals divided by the total shots on goal).
- Save percentage (SV%) – The percentage of the team’s shots on goal against that were saved (i.e., 1-(totals goals allowed divided by the total shots on goal against))
- PDO – The sum of a team’s shooting percentage (SH%) and its save percentage (SV%). It’s based on the theory that most teams will ultimately regress toward a sum of 100, and is often viewed as a proxy for how lucky a team is. (Source)

Pingback: CBC Edmonton News (TV): Re-cap of the Oilers first month and previewing tonight’s game against Chicago | The SuperFan
Pingback: Tracking the Pacific Division – As of November 30, 2018 | The SuperFan
Pingback: Tracking the Pacific Division – As of December 31, 2018 | The SuperFan
Pingback: Tracking the Pacific Division – As of October 31, 2019 | The SuperFan