The Pacific Division is wide open at this point as not a single team has posted a points percentage that would rank in the top ten league-wide. Vegas currently ranks first in the division but is 13th in the league, Vancouver is 15th and Arizona is 16th.
What’s crazy is that only two of the eight teams have a goal-share above 50% at even-strength this season: Vancouver with 50.67% and Arizona with 51.35%. The remaining six teams are in the bottom ten league-wide.
| Team | Goal Differential | Goals for% | League rank |
| Arizona | 4 | 51.35 | 13th |
| Vancouver | 2 | 50.67 | 16th |
| Vegas | -4 | 48.85 | 22nd |
| Anaheim | -9 | 47.06 | 25th |
| Los Angeles | -11 | 46.41 | 26th |
| Calgary | -17 | 44.37 | 27th |
| Edmonton | -22 | 43.6 | 28th |
| San Jose | -29 | 41.81 | 30th |
The Edmonton Oilers are only ahead of New Jersey, San Jose and Detroit when it comes to even-strength results – three teams destined for a draft lottery pick. What’s especially concerning is how poorly the Oilers rank in terms of shot-share metrics within the Pacific as they’re spending more and more time defending and playing in their own zone.
- Related: Related: Tracking the Pacific Division – As of November 30, 2019 – The SuperFan (2019, December 2)
Below are the division results at even-strength (5v5) as of December 31, 2019, with teams sorted by point-percentage. For each of the shot-share metrics, I’ve applied a basic heat-map to show which teams are doing well compared to the division teams and which are struggling. A description of each metric is at the end of this article.
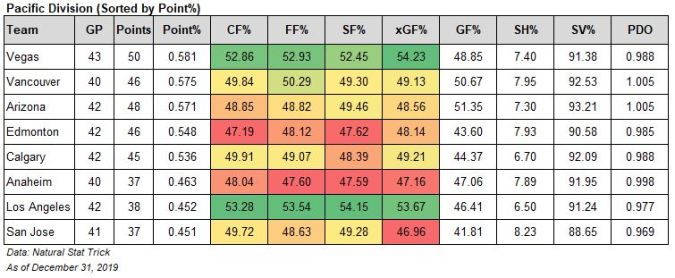
The Oilers score/venue-adjusted Corsi For% at even-strength continues to slide as they currently rank 26th in the league and have posted a Corsi For% of 46.53% over their last twenty-five games – ahead of only Detroit and the New York Rangers. Vancouver and Arizona aren’t faring much better, posting a 47.0% Corsi For% and likely unable to keep up with Vegas whose shot-share numbers rank in the top ten league-wide. Los Angeles continues to do well in terms of shot-share, but don’t appear to have the talent to convert their opportunities into goals or enough consistent goaltending. San Jose, Calgary and Anaheim are all around the 49.0% mark in terms of Corsi For% over their last twenty five games.
Below is a snapshot of the last twenty-five games for each team at even-strength, sorted by points percentage. Note the Oilers goal-share of less than 40% and their Corsi For% of 46.53%. I’d like to believe the Oilers will bounce back even slightly, but they’ve been spending a lot of their time without the puck – and that’s with and without their top players on the ice.
| Team | PTS | Point% | CF% | FF% | xGF% | GF% | SH% | SV% | PDO |
| Vegas | 29 | 0.580 | 53.49 | 53.48 | 54.54 | 52.88 | 8.12 | 91.74 | 0.999 |
| Arizona | 28 | 0.560 | 47.02 | 47.71 | 46.87 | 48.22 | 7.12 | 93.04 | 1.002 |
| Los Angeles | 27 | 0.540 | 55.09 | 54.82 | 55.19 | 48.95 | 6.01 | 92.51 | 0.985 |
| Calgary | 27 | 0.540 | 49.06 | 48.61 | 48.32 | 42.09 | 5.99 | 92.38 | 0.984 |
| San Jose | 26 | 0.520 | 49.58 | 49.01 | 48.19 | 45.54 | 8.96 | 89.22 | 0.982 |
| Vancouver | 25 | 0.500 | 47.05 | 47.36 | 45.73 | 44.49 | 7.09 | 92.36 | 0.994 |
| Edmonton | 24 | 0.480 | 46.53 | 47.69 | 47.14 | 39.96 | 8.05 | 89.34 | 0.974 |
| Anaheim | 19 | 0.380 | 48.84 | 48.73 | 47.77 | 41.95 | 7.03 | 90.98 | 0.980 |
From the looks of it, Vegas should be able to secure the top spot in the division, and I think should eventually move into the league’s top ten. The rest is anyone’s guess as every other team in the Pacific, except for Los Angeles, consistently gets out-shot and out-chanced.
Quick glance at each team’s special team units, and the Oilers continue to do well and get production from their powerplay and penalty kill. Below is each team’s combined goal rates which adds together the rate of goals for and against on the powerplay and penalty kill.
| Team | Special Teams Combined Goal Rates |
| Edmonton | 3.97 |
| Vancouver | 3.24 |
| Vegas | 2.83 |
| San Jose | 1.03 |
| Arizona | 0.21 |
| Calgary | -0.27 |
| Anaheim | -1.98 |
| Los Angeles | -3.98 |
Vegas has slipped slightly from last month when they posted a +4.09 goal rate, and San Jose has dropped from +3.26 to +1.03. Anaheim has improved quite a bit even though they’re still a negative team, jumping up from -4.17 at the end of November.
Data: Natural Stat Trick, Charting Hockey
Glossary:
- Points-percentage (Point%) – The total points accumulated divided by the points that were available, including extra time.
- Corsi For percentage (CF%) – The proportion of all the shot attempts the team generated and allowed that the team generated (i.e., Corsi For/(Corsi For + Corsi Against). This is used as a proxy for possession and can predict a team’s future share of goals (GF%).
- Fenwick For percentage (FF%) – The proportion of all the unblocked shot attempts the team generated and allowed that the team generated (i.e., Fenwick For/(Fenwick For + Fenwick Against). This is used as a proxy for shot quality and considers shot blocking a repeatable skill. It can also predict a team’s future share of goals, slightly better than Corsi.
- Shots For percentage (SF%) – The proportion of all the shots on goal that the team generated and allowed that the team generated (i.e., Shots For/(Shots For + Shots Against).
- Expected Goals For percentage (xGF%) – This is a weighting placed on every unblocked shot based on the probability of the shot becoming a goal. This depends on the type of shot, location and uses historical shot and goals data to come up with the probability for each unblocked shot. This has been found to be a better predictor of future goals than Corsi and Fenwick.
- Goals For percentage (GF%) – The proportion of all the goals that the team scored and allowed that the team generated (i.e., Goals For/(Goals For + Goals Against).
- Shooting percentage (SH%) – The percentage of the team’s shots on goal that became goals (i.e., total goals divided by the total shots on goal).
- Save percentage (SV%) – The percentage of the team’s shots on goal against that were saved (i.e., 1-(totals goals allowed divided by the total shots on goal against))
- PDO – The sum of a team’s shooting percentage (SH%) and its save percentage (SV%). It’s based on the theory that most teams will ultimately regress toward a sum of 100, and is often viewed as a proxy for how lucky a team is. (Source)
