The Oilers have been dreadful at even-strength (5v5) this season, now sitting 29th in the league with a goal-share of 43.75% – a -22 goal differential, scoring 77 goals and allowing 99. About 80% of the game is played in this state, so it’s critical that the Oilers start out-scoring their opponents more regularly if they intend on competing for a playoff spot.
One of the Oilers biggest issues is their inability to create offensive opportunities, as they currently rank 28th in the league when it comes to generating shot attempts, unblocked shot attempts (i.e., Fenwick, a proxy for scoring chances) and shots on goal. What’s worth noting is that defensively, they’ve been hovering around league average rates having done a decent job suppressing shot attempts and chances against. Unfortunately their goaltending has not been good, posting a team save percentage of 90.54% – good for 29th in the league.
So while we can expect that the Oilers rate of goals against to improve if the goaltending gets back to league average levels, we can’t have as much confidence in the offensive side of things as the team consistently spends more time defending and playing in their own zone.
What’s especially troubling is the Oilers lack of offence when they’re trailing in a game – a game state when most teams start controlling the flow of play more, taking chances as teams with the lead get into more of a defensive shell. The Oilers have posted a goal-share of 44.44% when trailing in games, good for 29th in the league and only one of eight teams with a goal-share below 50%. They rank 21st in terms of goals per hour with 2.39 and 28th in terms of goals against per hour with 2.98. And their underling numbers aren’t that much better either.
Note that for this analysis I’ll be looking at unblocked shot attempts (i.e., Fenwick) as the Oilers appear to be less of a shot-quantity/volume-shooting team and more of a shot-quality team under Tippett.
Below is a breakdown of the Oilers share of unblocked shot attempts when they’re leading in a game, trailing in a game and tied with an opponent. I’ve also included the league’s top Fenwick For percentage and the worst to show where in the range the Oilers fall.
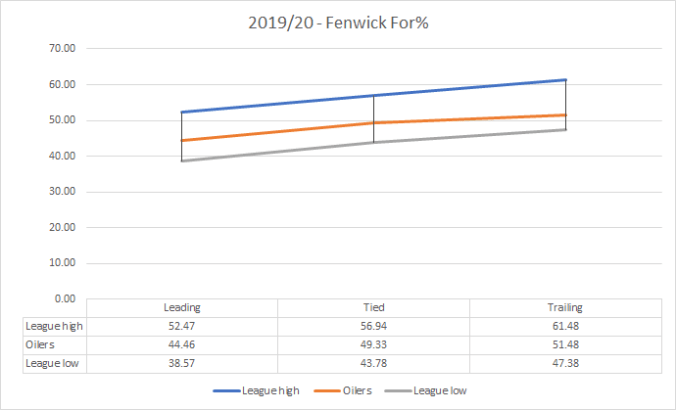
As expected, we see that the Fenwick for percentage is highest when team’s are trailing, doing more and taking risks to tie up the game, compared to when team’s are leading and playing more defensively. The Oilers are just below average when the game is tied or when they’re leading. But when they’re trailing, they’ve only posted a 51.48% share, which ranks in the bottom quarter of the league.
What’s interesting is that while they do allow slightly more shot attempts against when trailing, it’s their offense that goes completely dry. Below is breakdown of their rate of unblocked shot attempts generated in different score states, along with the best and worst rates in the league.
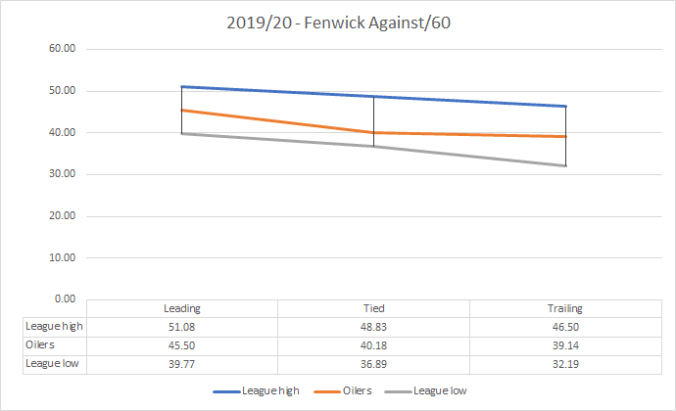
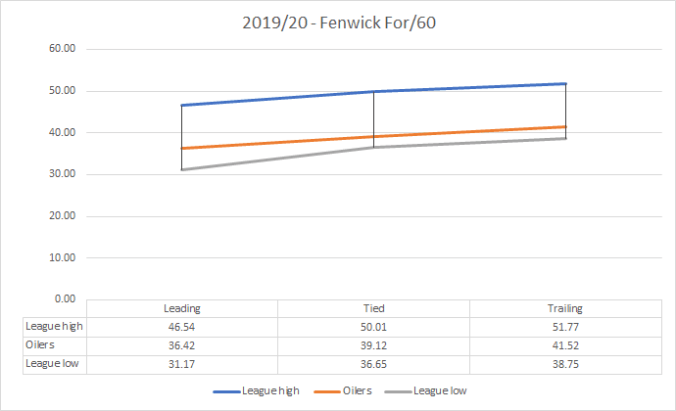
Offensively, there’s not much of a difference for the Oilers whether they’re leading or trailing – it’s like they use the same tactics and playing style regardless of the score. On average, teams see an increase of 6.35 unblocked shot attempts per hour when trailing compared to when they’re leading – the Oilers are on the low end with an increase of only 5.10.
It should also come as no surprise that the Oilers do a lot better offensively with McDavid on the ice when trailing as the Oilers generate 45.07 unblocked shot attempts per hour with him on the ice and only 39.53 without him. In other words, much closer to league average rates with him and closer to the Detroit Red Wings without him. This is one of the drawbacks of focusing so much on improving the penalty kill this past off-season and bringing in defensive-minded forwards to fill-out the bottom six. Yes, McDavid, Nugent-Hopkins and Draisaitl are going to see an increase in their ice-time proportion when the team needs a goal, but there’s still a big portion of ice time when the bottom six needs to contribute offensively and at least create chances.
For reference, below are the Oilers forwards, sorted by total even-strength ice time, and their proportion of the team’s ice time by the three different score-states.
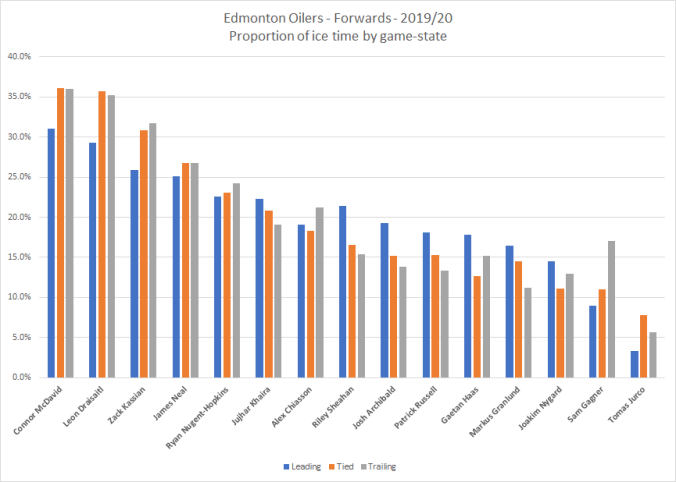
Minor observation: Sam Gagner sees a spike in his ice time proportion when the team needs a goal. I thought that was strange until I noticed that he has the highest on-ice rate of unblocked shot attempts when the Oilers are trailing in a game. Of the bottom-six forwards, he’s the one player who can chip in offensively. But unfortunately for him and others, the team can’t get a save. Below is a table of the forwards, sorted by the rate of unblocked shot attempts for per hour.
| Player | TOI | FF/60 | FA/60 | GF/60 | GA/60 | SH% | SV% | PDO |
| Gagner | 119.57 | 49.18 | 33.62 | 2.51 | 3.01 | 6.76 | 86.67 | 0.934 |
| Kassian | 222.83 | 45.77 | 41.74 | 4.04 | 3.50 | 12.30 | 89.08 | 1.014 |
| McDavid | 252.93 | 45.07 | 44.12 | 4.03 | 3.56 | 12.41 | 89.51 | 1.019 |
| Nygard | 91.03 | 43.50 | 38.23 | 3.95 | 0.00 | 11.32 | 100.00 | 1.113 |
| Granlund | 78.90 | 41.83 | 38.02 | 1.52 | 3.04 | 4.76 | 85.19 | 0.899 |
| Draisaitl | 247.67 | 40.94 | 47.48 | 2.91 | 3.63 | 10.08 | 90.26 | 1.003 |
| Jurco | 39.77 | 40.74 | 28.67 | 4.53 | 1.51 | 18.75 | 91.67 | 1.104 |
| Haas | 106.60 | 40.53 | 30.39 | 1.69 | 2.25 | 5.26 | 87.50 | 0.928 |
| Neal | 188.02 | 40.53 | 38.93 | 1.28 | 4.15 | 4.55 | 85.71 | 0.903 |
| RNH | 170.38 | 40.14 | 37.68 | 1.76 | 2.11 | 6.10 | 92.50 | 0.986 |
| P. Russell | 93.88 | 39.62 | 35.79 | 1.92 | 2.56 | 6.52 | 88.89 | 0.954 |
| Khaira | 134.50 | 38.81 | 35.24 | 0.89 | 3.57 | 2.94 | 86.67 | 0.896 |
| Chiasson | 149.10 | 38.23 | 38.63 | 1.61 | 2.01 | 5.63 | 92.06 | 0.977 |
| Archibald | 97.52 | 35.69 | 38.15 | 0.62 | 4.31 | 2.44 | 82.50 | 0.849 |
| Sheahan | 108.13 | 35.51 | 36.07 | 1.11 | 3.33 | 4.17 | 86.05 | 0.902 |
Another thing I found was that when the team needed a goal and McDavid was on the ice, the rate of shots against would go up. In fact, his on-ice Fenwick For% when the Oilers are trailing is currently at 50.53%, which among the Oilers forwards is only better than Chiasson (49.75%), Sheahan (49.61%), Archiabald (48.33%) and Draisaitl (46.30%).
The fact that Draisaitl ranks last made me wonder what the splits were like between him and McDavid. Here’s what their share of unblocked shot attempts are like with and without each other at even-strength when the Oilers are trailing. I also included the goal-rates and goal-share.
| Combo | TOI | FF/60 | FA/60 | FF% | GF/60 | GA/60 | GF% |
| Together | 184.15 | 42.36 | 49.85 | 45.94 | 3.58 | 3.91 | 47.83 |
| McDavid without Draisaitl | 68.78 | 52.34 | 28.79 | 64.52 | 5.23 | 2.62 | 66.67 |
| Draisaitl without McDavid | 63.51 | 36.84 | 40.62 | 47.56 | 0.94 | 2.83 | 25.00 |
| Neither | 387.23 | 39.98 | 35.64 | 52.87 | 1.55 | 2.63 | 37.04 |
Small sample size, but it appears that part of the reason McDavid has only been league-average when the the team is trailing is because of Draisaitl. I don’t expect Draisaitl’s numbers away from McDavid to be great due to the lack of talent on the roster to play him with. But McDavid does see a significant jump in his Fenwick For% due to a big drop in the rate of shots against when he doesn’t have Draisaitl with him.
You’ll probably get a lot of resistance doing this, but one way to increase Draisaitl’s rest-time and potentially get more overall productivity from him is to reduce his minutes when the team is trailing. He’s not doing well in that game-state offensively, dragging down his linemates, and it appears that the low-event bottom six are at least getting a decent share of the shot attempts.
Summary
- The Oilers aren’t very good when it comes to Fenwick For% at even-strength, especially when they’re trailing in games.
- It’s their inability to create offence when trailing that’s especially troubling as they rank near the bottom of the league in terms of Goals For% and Fenwick For%.
- Part of the problem is their bottom six who while do a good job suppressing shots when the team is trailing, have a lot of trouble creating chances. The team is in dire need of offensive talent, not just guys who can kill penalties.
- The other problem is the goaltending, which ranks near the bottom of the league at even-strength and when the team is trailing.
- Draisatl has been playing very poorly defensively as reflected by his on-ice share of shot attempts and the rate of unblocked shot attempts against when the team is trailing.
Data: Natural Stat Trick

None of these stats mean anything impactful without System insights discussing causality to ground them.Playing from behind or chasing the game is synonymous with being Outcoached. The stats you show simply reflect a team being consistently outcoached more than a Team underachieving or discombobulatin It is possibly quite reckless to post stats without causality Sunil….people will not know what to make of it all.Numbers alone have never been enough and really with proper dynamic causality attached to them it just becomes a burden to the EveryFan. With proper causality connected to them these same numbers can be used to illuminate the game and make it more digestible.
Pingback: Protecting leads | The SuperFan