
While the special teams continues to produce, the Oilers even-strength (5v5) play remains an area for concern. Of the 11 teams that currently have a point percentage of 0.600 or above, only the Oilers have an even-strength goal-share below 50.0%, sitting 23rd overall with a 47.20% goal-share and a goal-differential of -7. Over the last three seasons, only two teams have finished their season with a 0.600 point percentage and a goal-share of less than 50.0%.
What’s encouraging is that it appears the Oilers are at least trying to generate more offence. What we know about this team based on their overall shot metrics is that while they don’t generate a lot of shot attempts (Corsi), they do appear to be more focused on getting quality chances as reflected by the expected goal metric (Source: Charting Hockey).
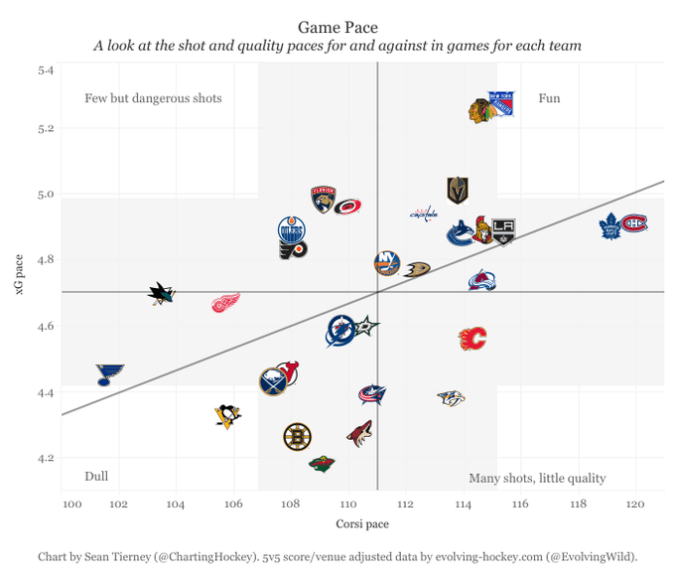
Here we see that while the Oilers are below the league-wide average of Corsi pace, which is at around 111 total shot attempts (for and against) per hour, they are above average when it comes to the total expected goals (for and against) per hour (4.70). Currently, the Oilers generate 2.26 expected goals per hour, good for 14th in the league. And allow 2.31 expected goals against, which is ninth highest in the league.
What’s interesting is that the Oilers do appear to be trying to play with more pace as their total rate of shot attempts for and against have been gradually increasing, and are having an impact on their rate of scoring chances (as reflected by expected goals) at both ends of the rink. Below is the Oilers rate of shot attempts (Corsi) per hour as well as their rate of expected goals (xG) per hour, over rolling 10-game segments. Note again that the rates includes events for and against.

Couple things to note here. Starting with their Corsi/60 represented by the blue line, the Oilers were at and around the league average of 111 events per hour at the start of the season as they generated one of the lowest rates in the league and didn’t allow a lot either. However over the last ten games, they’ve moved up in the league, generating more shot attempts, getting closer to league average rates, but also allowing a lot more. And it appears playing with more pace has increased the rate of expected goals for and against, as represented by the orange line. If we go back to Charting Hockey’s pace graph at the top of the article, the Oilers would be moving from the top left quadrant (“Few but dangerous shots”) to the top right quadrant (“Fun”), clustered with Vegas and Washington.
Unfortunately for the Oilers, the increased pace of play as represented by Corsi and expected goals hasn’t improved their overall share of expected goals. Over the last ten games, the Oilers expected goal-share sits at 47.66%, indicating that their new approach of allowing more shot attempts to potentially create more offensively isn’t working very well. And their actual results at even-strength reflect that as well as they’ve posted a 40.82% goal-share over the last 10 games.

At his pre-game media availability on Friday, Tippett may have alluded to his team gradually taking more chances, but I’d be interested to know from him if their shot-based metrics were a result of adjusted tactics or if there were other factors such as injuries to RNH and Kassian and the ensuing line combinations at play here. It’ll also be interesting to track games 31-40 to see if they slow down their pace again, aligning with what they were generating and allowing in terms of shot attempts over the first ten games of the season.
You have to take some chances to get back in the game, but the chances we are taking…they aren’t giving us any advantage and we are giving up goals. We have addressed those things the past couple of days. Source: Edmonton Oilers
When I did recently see the uptick in shot attempts and chances against, I did write the following:
The concern I would have with the team as a whole giving up more chances (potentially in an attempt to create more offensively) is that their goaltending remains a little suspect, especially with Mike Smith still getting plenty of playing time. He currently ranks in the bottom five among 38 goalies (>500 minutes) when it comes to save percentage and goals-saved above average.
And that does appear to be the case. Below is the Oilers team save percentage over rolling ten game segments.
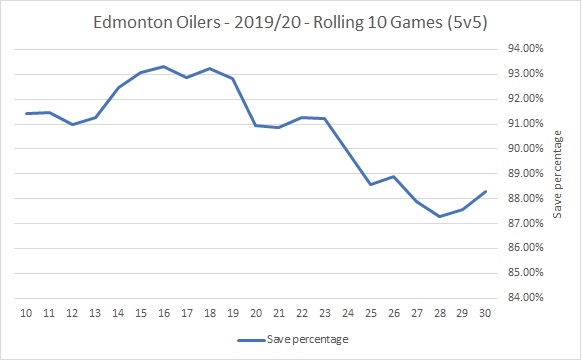
As the shot attempts and chances against have gradually increased over the course of the season, the team save percentage has gradually declined. As much as I’d like to, I can’t say for sure that it’s just the goalies that can’t handle the workload. I suspect that playing with more pace also exposes the Oilers lack of skill, speed and depth on the roster. Again, it’s something that Tippett might have an explanation for, if in fact he has been trying to play with more pace.
Data: Natural Stat Trick, Charting Hockey
Related: Rolling along – The SuperFan (2019, November 27)

Pingback: Sliding | The SuperFan