The Oilers are sliding, and they shouldn’t be surprised.
The good news is that the Oilers currently rank second in the Pacific with 40 points, and fifth in the Western Conference. The problem is their overall results aren’t good enough, especially at even-strength, and they’ve been trending downwards for a while.

While the powerplay and penalty kill continues to thrive, it’s the even-strength (5v5) play that is dragging down the Oilers overall results. Below is the cumulative total of goals-scored, which now sits at -12 – a goal-share of 45.77%, good for 26th in the league.

The underlying shot-share numbers have been poor, and appear to be getting worse. While they did show some signs of life only a few weeks ago, their overall play has been declining ever since. I wrote last week that I think it had to do with the team potentially trying to generate more offence by focusing less on defensive play, but that’d be something only the coach could confirm.
| Point % | CF% | FF% | xGF% | GF% | SH% | SV% | PDO |
| 0.588 | 47.88 (26th) |
48.43 (22nd) |
48.90 (22nd) |
45.77 (26th) |
8.54 | 90.68 | 0.992 |
Below are the Oilers Corsi For%, Fenwick For% and xGoals For% over rolling 10-game segments this season. A glossary describing the metrics can be found below.

The last ten games have been extremely poor, with the Oilers posting shot-share metrics well below league average levels. The expected goal-share has slid down to 45.0%, which again might be due to the team taking more risks in an attempt to generate offence. The Oilers were doing something right early on, but it appears they’ve adjusted their tactics in an attempt to generate offence.
- Related: Picking up the pace – The SuperFan (2019, December 7th)
The other concerning issue is the team’s performance at even-strength both with and without McDavid this season. In year’s past, we would see all the shot-share numbers be above at least 51.0% with their best player on the ice. This year, it’s been a different story, as the Oilers even with McDavid have posted shot-share numbers below 50.0%.
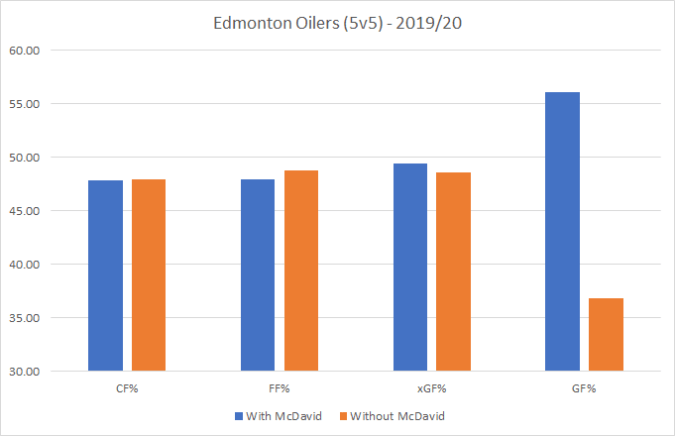
The good news is that the overall goal-share has been outstanding with McDavid. But it does make you wonder how much better his on-ice goal-share and point totals would be if the Oilers were spending less time in their own zone and more time with the puck. The lack of skill on the roster, combined with a blueline that has only a few puck-movers, is what I think is driving the shot-share numbers downward.
The last ten game have been especially concerning, with the whole team including McDavid struggling to generate offence and spending more time defending. Below we see that the shot-share metrics are closer to the 45.0% percent range (!), with the goal-share being below the break-even mark even with McDavid.
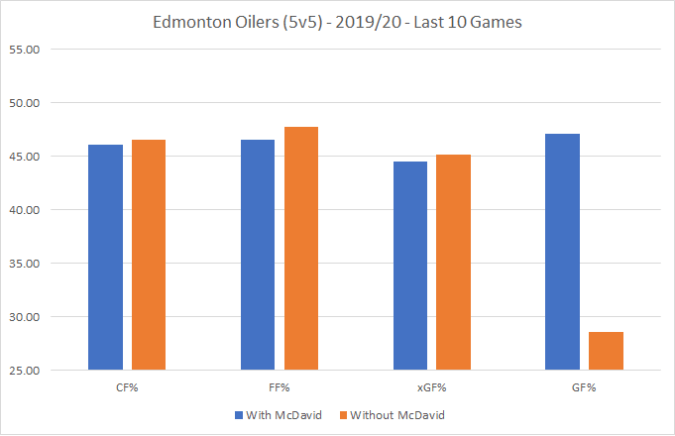
The Oilers have posted a -1 goal differential with McDavid, and a -12 goal differential without him over the last ten games. Not even the special teams can bail them out as the outstanding powerplay has scored ten goals (and allowed one) over the last ten, while the penalty kill has actually struggled allowing six goals.
Can’t say their current results are too surprising as the team lacks skill and depth, and their shot-share metrics have been below average for most of the season. The question again comes back to the Oilers management and how they view the overall results and where the team has been trending.
With the team having accumulated 40 points, does management think the results are real and sustainable? Or do they recognize that they’re lacking a significant amount of skill and depth in all positions, and start to add pieces, either from their own development system or through the trade market. Thinking heading into the season that this was going to be a development year, and based on their actual results and underlying trends, I would expect the team to hold off on making any drastic changes and start to give some of the younger prospects a chance to play in Edmonton and further their development.
It would have been nice if the team took a positive step and posted underlying numbers that demonstrated sustainability. But the reality is that they’re not good enough to compete for a championship and should be using this season to properly evaluate the prospects that they do have.
Data: Natural Stat Trick
Also, I made an appearance on CBC Radio Active this week. Will post the link when it’s available: CBC Radio Active (2019, December 11)
Glossary
- Corsi For percentage (CF%) – The proportion of all the shot attempts the team generated and allowed that the team generated (i.e., Corsi For/(Corsi For + Corsi Against). This is used as a proxy for possession and can predict a team’s future share of goals (GF%).
- Fenwick For percentage (FF%) – The proportion of all the unblocked shot attempts the team generated and allowed that the team generated (i.e., Fenwick For/(Fenwick For + Fenwick Against). This is used as a proxy for shot quality and considers shot blocking a repeatable skill. It can also predict a team’s future share of goals, slightly better than Corsi.
- Expected Goals For percentage (xGF%) – This is a weighting placed on every unblocked shot based on the probability of the shot becoming a goal. This depends on the type of shot, location and uses historical shot and goals data to come up with the probability for each unblocked shot.
- Goals For percentage (GF%) – The proportion of all the goals that the team scored and allowed that the team generated (i.e., Goals For/(Goals For + Goals Against).
- Shooting percentage (SH%) – The percentage of the team’s shots on goal that became goals (i.e., total goals divided by the total shots on goal).
- Save percentage (SV%) – The percentage of the team’s shots on goal against that were saved (i.e., 1-(totals goals allowed divided by the total shots on goal against))
- PDO – The sum of a team’s shooting percentage (SH%) and its save percentage (SV%). It’s based on the theory that most teams will ultimately regress toward a sum of 100, and is often viewed as a proxy for how lucky a team is. (Source)

Pingback: Line combinations that might help | The SuperFan
Pingback: Running operations | The SuperFan