Special teams tracking

EGsFNSeUEAAebcf.jpg

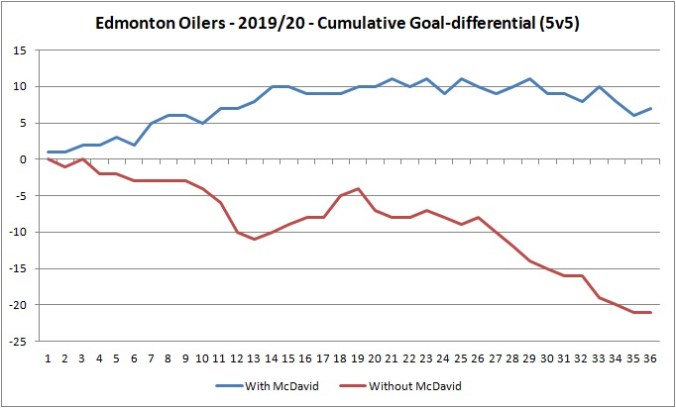
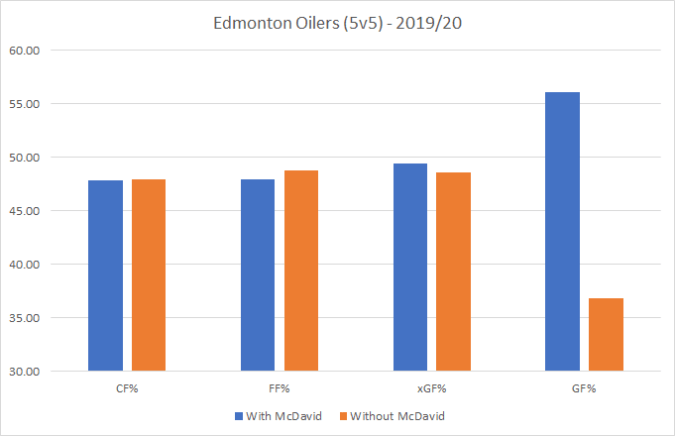
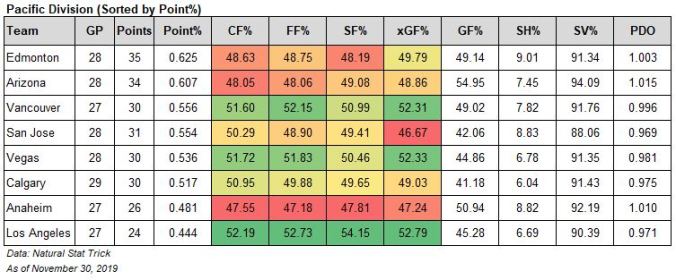
With the Oilers play at even-strength (5v5) being so poor, it’s become more and more imperative that the club gets as much out of their special teams as possible. The Oilers currently have a 43.90% goal-share at even-strength, a -20 goal differential – fourth worst in the league only ahead of New Jersey, San Jose and Detroit. What’s especially alarming is that their underlying shot-share metrics (47.30% Corsi For%, 48.17% Fenwick For%) are poor and continuing to decline, indicating that they’re spending more time defending and less time in the offensive zone at 5v5.

Now our expectations of the Oilers special teams should be higher considering the high-end offensive talent on the roster for the powerplay and the amount of work and resources management put towards fixing the penalty kill this past off-season. In my mind, the powerplay should be elite, while the penalty kill should at least be somewhere above league average rates (which would be a significant improvement from last season).

So far things have gone well for the most part as the Oilers rank second in the league scoring 10.69 goals per hour on the powerplay. And their penalty kill sits fourth in the league allowing  5.39 goals per hour on the penalty kill. To put things into context, the average rate of goals on special teams over the last three seasons is about 7.10 per hour.

Special Teams (2019/20) Rate League rank
Powerplay – Goals for/60 10.69 2nd
Powerplay – Fenwick for/60 78.12 8th
Powerplay – Shooting% 18.95% 1st
Penalty Kill – Goals against/60 5.39 4th
Penalty Kill – Fenwick against/60 74.11 21st
Penalty Kill – Save% 89.90% 3rd

Note: I do use rate stats (i.e., goals, shots per hour) for special teams as it factors in the time a team takes to achieve their objectives. Powerplay units are up against the clock when they’re deployed, so team’s that can get results faster should be considered more efficient. I also use unblocked shot attempts (i.e., Fenwick) to assess a team’s ability to score or prevent goals on special teams. Blocking shots and keeping pucks to the outside is a big part of killing penalties, so Fenwick gives us a sense of well the skaters are doing their jobs and helping out their goaltenders.

Powerplay

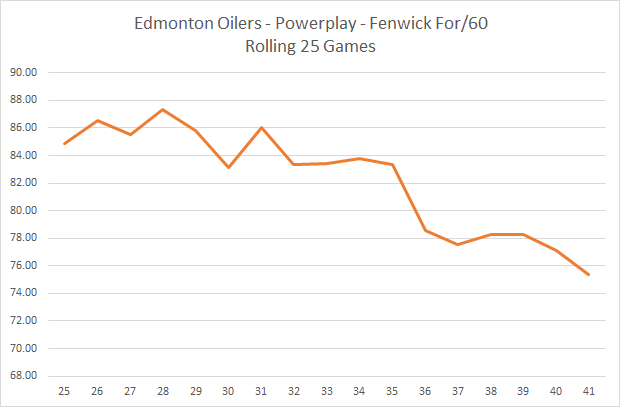
The Oilers powerplay is looking good for the most part, getting results and appearing to have the right tactics in place as reflected by their rate of unblocked shot attempts. Couple concerns however, the first of which is the team shooting percentage which could dip down if individual players get into slumps or if they run into a few hot goaltenders. The second concern is around their declining rate of shot attempts, which was at one point one of the best in the league. Below is a graph showing the Oilers rate of unblocked shot attempts per hour over rolling 25 game segments. They’re still around the league average rates, but it’s a little odd  that a team with that much elite talent has seen such a drop.

Oilers PP FF60.png

The other concern with the Oilers powerplay is that they’re allowing the highest rate of shorthanded goals against this season (2.08 per hour!), so far giving up seven. This one is on the goaltending as it’s not like the Oilers are allowing a ton of chances against on the powerplay – they allow the sixth lowest rate of shot attempts against, while the team save percentage is second worst in the league with 78.79% . This has to be a spot of bother for the coaching staff that is doing everything they can to improve their overall goal differential of -11.

Penalty kill

While the powerplay is good and has some underlying issues that need to be addressed, the penalty kill is good and is actually showing signs of progress. Over the full season, the Oilers have allowed 74.11 unblocked shot attempts per hour, slightly worse than league average and ranking 21st in the league. However, that rate has gradually been been declining over the course of the season, with the Oilers posting a rate of 67.71 unblocked shot attempts against per hour over their last twenty-five games – a rate that would have them in the top ten league-wide. Slight uptick happening recently, so it’s worth monitoring as the season progresses.

Oilers PK FA60

Something that I think the coaching staff might overlook is the rate of shot attempts against when certain players are on the ice. Below are the regular penalty killing forwards this season (minimum 30 minutes of ice time), sorted by their on-ice rates of unblocked shot attempts against (FA/60).

Player TOI TOI/GP FA/60 GA/60 On-Ice SV%
Ryan Nugent-Hopkins 58.75 1.68 57.19 5.11 87.50
Jujhar Khaira 63.58 1.72 59.45 2.83 93.33
Patrick Russell 33.67 1.12 67.72 12.48 76.67
Riley Sheahan 81.52 2.26 85.38 4.42 93.18
Josh Archibald 70.43 2.20 89.45 3.41 94.74
Markus Granlund 40.72 1.31 92.84 10.32 84.09
Leon Draisaitl 43.75 1.07 94.63 5.49 90.91

The team does a lot better keeping pucks to the outside when Nugent-Hopkins and/or Khaira are on the ice, with the actual rate of goals against being in a reasonable range. Where the team does see a spike is when the likes of Sheahan, Archibald or Granlund (who was demoted because of his poor penalty kill numbers) have been on the ice. What’s especially interesting to me is that Archibald’s on-ice rate of shots against isn’t that much better than Granlund’s. The only difference being that Granlund had a higher rate of goals against when he was on the ice  – which we know can often be goalie performance driven. Just compare Granlund’s on-ice save percentage (84.09) to Archibald’s (94.74). More on this in a second.

For those interested, here’s how the Oilers defencemen have done on the penalty kill so far this season, again sorted by their on-ice rate of unblocked shot attempts against. Interesting to me at least is that Nurse is not leading the team in ice time and looks more to be on the second penalty kill unit; the rate of shots against also increase when he’s on the ice. He’s also not a regular option on the powerplay, which should factor in to his next NHL contract.

Player TOI TOI/GP FA/60 GA/60 On-Ice SV%
Ethan Bear 73.58 1.79 74.20 5.71 88.89
Oscar Klefbom 118.40 2.89 79.05 6.59 88.79
Kris Russell 102.43 2.56 79.08 5.86 89.90
Darnell Nurse 81.78 1.99 81.43 5.14 90.91

The big question mark is the team save percentage (89.90%) on the penalty kill, which sits third in the league and can be expected to drop considering the talent-level between the pipes. Both goaltenders have been very good so far this season shorthanded. Among 41 goalies who have played at least 80 minutes on the penalty kill, Mikko Koskinen ranks ninth  with a save percentage of 0.894 (115 minutes), while Mike Smith ranks third with 0.917 (92 minutes). The issue is that both goalies are posting save percentages above their NHL career norms. Over the last three seasons prior to 2019/20, Mike Smith has played 152 games (752 minutes) and posted a save percentage of 0.865. Koskinen has only played 55 games (243 minutes) but posted a save percentage of 0.854 shorthanded. Worth noting that both of their historical penalty kill save percentages are slightly below the league average team save percentages from the last three seasons (0.867). I’d expect the Oilers to finish the year with a team save percentage closer to league averages.

One last note about the penalty kill. The Oilers do very little to squeeze out shorthanded goals while killing penalties. While they’ve allowed seven shorthanded goals, tied for most in the league, they’ve only scored once shorthanded themselves – the lowest rate of goals scoring in the league. They’re also generating the lowest rate of unblocked shot attempts in the league on the penalty kill, indicating that the coaching staff doesn’t really care to play more aggressively while shorthanded. Considering the the team is desperate for goals, it might be an area worth looking into.

Macaroni

To sum up how well the entire special teams are doing, I look to combine the rates of goals for and against on the powerplay and the penalty kill. Below is how the Oilers have done over the course of the season.

Oilers Macaroni - 20191231

To put things into context, teams with great special teams post a combined goal rate above +1.50 (Source). Last season, Tampa Bay was over 6.00 as their powerplay was ranked first and only allowed three shorthanded goals. And their penalty kill was first and also scored the fifth highest rate of shorthanded goals. Five other teams posted a combined goal rate above +1.50.

The Oilers got some outstanding contributions from the special teams early on, which helped bank those points but also masked their major issues at even-strength. Now we’re seeing the special teams come back down to earth a bit, but should still expect them to finish well considering the talent up front on the powerplay and the amount of resources put towards addressing the penalty kill this past off-season. With the Pacific division being wide open this season, it’s critical that the Oilers correct their underlying issues and adjust their roster and deployment tactics as necessary.

Data: Natural Stat Trick

The SuperFan Podcast – Episode 10 – Keith Anthony

3000by3000 (1)This week on the podcast I was joined by Keith Anthony (@keyantonyo) to discuss the Bakersfield Condors and the Oilers prospect pool. Keith has done a lot of work keeping tabs on the Condors using video analysis and his own tracking data – you can find his past work at his blog: Petro Praxis. Definitely worth a follow on Twitter if you want to know how the Oilers prospects are doing.

Keith shared his perspective on player development and the Oilers overall approach under Ken Holland. We also discussed specific players who’ll be critical to the Oilers long-term success including Caleb Jones, Kailer Yamamoto, Tyler Benson and William Lagesson.

Full segment below:

Podcast channels:

Music: Anitek. “Show me.” Anitek Instrumentals Vol. 4, 2010. Jamendo.com

Running operations

cut

Couple things occurred on Saturday that caught my attention and made me think about  how the Oilers choose to operate in year five of the McDavid era.

First twenty games

Dave Tippett made some comments to the local media about the Oilers current situation and how things compare to the first twenty games of the season.

The way I look at it, the first 20 games we were pretty solid coming out of the gate. We won some games. There were some games we didn’t play as well. But we had a lot of…there was a lot of purpose in what we were doing.

And the next 20 games, what happens is after the first month the league starts to get to know your team and you got two guys driving the offence, like driving it.  Fifty points and all of a sudden if you’re another team coming in here . You’re saying ‘Hey better take those guys [McDavid and Draisaitl] away’. So it gets harder. So when it gets harder for those guys to score then there’s a frustration that comes in and now you start trying to do more, trying to do more, trying to do more. And you’re chasing the game all the time. And that’s where Drai’s been chasing the game for a while. And he’s been chasing the game because he’s trying to win. And it’s gotten harder and harder for him because other team’s are really bearing down on those guys. – Oilers head coach Dave Tippett (Source: Edmonton Oilers)

Couple thoughts.

One, while the results were excellent for the Oilers in their first twenty games (12-6-2, 0.650 points percentage), there were some warning signs that indicated there might be trouble ahead. The biggest issue was their performance at even-strength (5v5), as the team posted only a +3 goal differential and a 52.00% goal-share, which was actually fourth best in their division. The Oilers even-strength deficiencies were clearly being masked by a very good powerplay and penalty kill, both of which continue to rank in the top five league-wide.

The Oilers other issue was their underlying shot-share metrics over those first twenty games, as the club posted a Corsi For% (i.e., a proxy for possession) of 48.62%, 23rd in the league and only ahead of Anaheim in the Pacific division. Their Fenwick For% (i.e., a proxy for scoring chances) wasn’t much better, ranking 20th in the league with 48.93% and again only ahead of Anaheim. Note that these numbers have been score and venue adjusted. What was especially troubling in those first twenty games is how poorly then ranked in terms of generating shot-attempts, unblocked shot attempts and shots on goal, as they ranked in the bottom six in the league – which is where they also sit today.

What the Oilers also should’ve identified in those first twenty games was the team’s sub-par underlying numbers when McDavid and Draisaitl were on the ice. The actual results were excellent, with the Oilers getting 70.59% of the goals when they were together, outscoring opponents 24-10. But they were also spending more time defending and playing in their own zone during those twenty games.

Here’s how the Oilers did when McDavid and Draisaitl played together in the first twenty games. McDavid spent 88% of his total ice time at even-strength playing with Draisaitl. Numbers have been score and venue adjusted.

TOI CF% FF% GF% On-Ice SH% On-Ice SV% PDO
300.72 47.84 47.22 70.59 15.27 94.21 1.095

While the goal-share was excellent, driven largely by an on-ice PDO of 109.5, the duo posted a Corsi For% of 47.84% and a Fenwick For% of 47.22. While we can expect a top-line’s shot-share to take a hit due to playing against the best competition, I would not expect the Oilers to actually do better without them on the ice. Without McDavid and Draisaitl, the Oilers posted a Corsi For% of 49.40% and a Fenwick For% of 50.03% in those first twenty games.

  • Related: Sliding – The SuperFan (2019, December 12

Seeing this early on, the team should not be surprised that after 41 games they rank 25th in terms of Corsi For% (47.30%) at even-strength and 23rd in terms of Fenwick For% (48.17%). And most importantly, they rank 28th when it comes to goal-share with 43.90%. As for Tippett’s comment, I would argue that the league already knew the Oilers weaknesses before the season started and exploited them even further as the roster didn’t change.

Granlund

Granlund

The second event on Saturday was the demotion of Markus Granlund, which on the surface isn’t a big deal as the player had been healthy-scratched often as of late, and is on a $1.3 million contract that expires this coming summer. What the move does indicate is that the Oilers still lack the ability to gather information, conduct analysis, and make decisions geared towards winning. Issues that really plagued the Oilers hockey operations during the previous manager’s regime and haven’t been addressed since by the owner.

When Granlund was signed this past summer, he was touted as a penalty kill specialist who could help the bottom-six forwards. However if the Oilers had conducted a simple analysis using publicly available data, they would have seen that his on-ice numbers on the penalty kill were actually poor and that his reputation was being bolstered by his previous team’s overall success. In case you missed it, below is what I put together shortly after the Oilers signed Granlund in July.

It really should be no surprise to the Edmonton Oilers that Granlund’s penalty killing numbers were so dreadful, as the Oilers allowed a rate of 10.32 goals against per hour when he was on the ice – the highest rate among the six most regular penalty killing forwards (those that have played at least 40 minutes). To put things into perspective, the Oilers as a team have allowed 5.39 goals against per hour this season, good for fifth best in the league. Over the previous three seasons, teams allow an average of 7.09 goals against per hour on the penalty kill.

Last season in Vancouver, which had one of the penalty kills in the league, Granlund posted an on-ice rate of 9.16 goals against per hour – one of the worst on the team and among forwards across the league who played a similar amount of minutes. The rate of unblocked shot attempts jumped up when Granlund was on the ice both this season in Edmonton and last season in Vancouver.

While the signing of Granlund was a low-risk move, Oilers management could have saved themselves some cap-space and potentially given those minutes to a more productive player had they just done a brief analysis using publicly available data. Instead, they’re paying an NHL salary to an AHL-bound asset and showing little overall progress in terms of building a championship contender.

If the Oilers are serious about competing, management really needs to ramp up their information gathering, analysis and overall decision-making. And that has to occur before and after every transaction they make to ensure they’re leveraging as much value as possible from their roster.

Data: Natural Stat Trick

Life line

mcdavid2

The Oilers even-strength (5v5) results have been very poor thus far, as the Oilers rank 27th in the league in terms of goal-share with 45.21% – scoring 66 goals and allowing 80. Thankfully their powerplay and penalty kill, which has posted a net goal differential of +12, has offset their poor even-strength results and helped them secure 42 points after 36 games.

While it remains to be seen if their special teams can continue bailing the team out (the powerplay doesn’t look like it’s slowing down anytime soon, while the penalty kill has begun to slip) the Oilers desperately need help, either in the form of on-ice personnel or possibly new coaching tactics to bring their even-strength results up to respectable levels.

The other factor that can drive results is of course McDavid who has the talent and track record now of being a true difference maker. Below is the Edmonton Oilers even-strength goal-share  since 2015/16 with McDavid on the ice, compared to their goal-share without him, along with the difference.

Season Goal-share with McDavid Goal-share without McDavid Difference
2015/16 50.70% 40.00% +10.70
2016/17 62.10% 48.90% +13.20
2017/18 57.04% 41.62% +15.42
2018/19 50.66% 40.74% +9.92

This season, it’s been no different. The Oilers have so far posted a goal-share of 55.07% with their captain on the ice, and a goal-share of 36.36% without him. Remarkably, their depth has posted results even worse than years past, posting a goal-differential of -21 without McDavid. And it doesn’t look like even McDavid can save them, as his  on-ice results have gradually been tapering off.

Below is the team’s cumulative goal-differential with McDavid on the ice (blue line), compared to the team’s cumulative goal-differential without him (red line).

20191217 - Goal differential.jpg

The first thing that jumps out is how quickly the results without McDavid have declined, and the amount of work now required to dig out of this mess. A big reason why the Oilers have struggled is their inability to control the flow of play and generate scoring chances. Over the last 15 games, which is where we’ve seen the sharpest decline, the Oilers have posted a 46.81% Corsi For% (a proxy for possession) and a 48.14% Fenwick For% (a proxy for possession) without McDavid on the ice. It was obvious in the summer and it’s been made very clear now that the moves the team made to shore up the depth aren’t good enough and are now costing the team wins in the standings.

The second thing that jumps out is McDavid’s goal-differential, which has stagnated around the +10-mark for quite sometime now and currently sits at +7. While that isn’t bad, keep in mind he finished the 2016/17 season with a +30 on-ice goal-differential at even-strength, and followed that up with a +20 on-ice goal-differential in 2017/18; goal-shares were above 55% in both of those seasons. Last season appeared to be an anomaly for him as he only finished with a +2 on-ice goal-differential, which can probably be attributed to being overplayed and the coaching tactics that season. He wasn’t able to make up for the goals scored against when he was on the bench, and unfortunately it looks like the same thing will happen this season.

One reason for that is the team’s inability to control play even with McDavid on the ice, as the Oilers often get out-chanced even with him on the ice. What’s especially troubling is the fact that the Oilers on-ice share of scoring chances (i.e., Fenwick) have been gradually declining, making me wonder if the injury McDavid sustained at the end of last season hasn’t healed or if he’s feeling fatigued. Note that the Oilers on-ice shot-share metrics with McDavid on the ice over the course of the 2019/20 season are well below his career norms (i.e. seasons prior to 2019/20).

McDavid on-ice (5v5) Career prior to 2019/20 2019/20
Corsi For% 51.28 47.21
Fenwick For% 51.81 47.05
xGoals For% 53.05 47.89

Below is the Oilers share of scoring chances with McDavid on the ice, over rolling ten game segments. It’s mind-blowing to see the best player in the world in his prime post such poor on-ice shot-share numbers, spending more and more of his ice-time without the puck.

McDavid FF.jpg

While McDavid has the ability to carry a team and make up for his teammates mistakes, it doesn’t appear he alone will be able to secure the Oilers a playoff spot this season. The Oilers desperately need skill and talent to remain competitive, contributing offensively and to potentially take some of the workload off of McDavid who clearly hasn’t been himself. The other frustrating part in all of this is that the lack of talent and effective coaching tactics to control the flow of play is really holding back McDavid’s offensive potential, as he could be scoring more often if the Oilers had the puck more frequently.

Data: Natural Stat Trick

Line combinations that might help

Haas-1040x572.jpg

In an attempt to find balance against a good Dallas team tonight, the Oilers have shuffled their line combinations with McDavid, Draisaitl and Nugent-Hopkins each centering their own lines.

On the surface, these line combinations are fine. Ideally, the Oilers have three good lines that can chip in offensively and give opposing teams problems with match-ups. The problem is that the Oilers don’t have enough talent on the wings to be a three-line team, but Tippett seems to expect the top players to carry the load and make the best of their situation.

We’re looking for some balance, just some stability in our line up. I look at those three guys, three of our top players. And we need those players not only to play well themselves, but to drag some people along with them. That’s what good players do, they make other players around them better and we’re hoping that’s the scenario tonight. Source: Edmonton Oilers

It’ll be interesting to see how long the line combinations stick, especially if the Oilers fall behind on the scoreboard early on, something that’s very likely to happen.

While the line combinations aren’t terrible, I don’t think they’ll address the Oilers current issue preventing goals at even-strength (5v5) or their inability to out-shoot and out-chance opponents. Over their last ten games, the Oilers have been outscored 13-30, a goal-share of 30.23%  – second worst only to the Red Wings. Their even-strength issues, I should note, is not a recent trend as they’re now fourth worst in the league over the entire season in terms of goal-share, ahead of only New Jersey, San Jose and Detroit.

And when it comes to shot-based metrics, the Oilers have seen their numbers decline over the course of the season (as noted in my last post). Taking the full season into account, the Oilers rank in the bottom third of the league when it comes to Corsi For%, Fenwick For% and Expected Goals For%.

20191213 - Shot share at 5v5

Over the last ten games, the Oilers have posted the following:

  • Corsi For% – 45.41% (29th)
  • Fenwick For% – 46.02% (29th)
  • Expected Goals For% – 43.50% (30th)

The somewhat good news is that there may be a way to address these underlying issues and help improve the goal-share leveraging the existing roster of players. These potential  line combinations won’t carry the Oilers to a championship, but can at least help stop the bleeding. Especially when it comes to their rate of expected goals against, which ranks 23rd in the league with 2.34, and is getting worse. And it’s based on line combinations that have been tried before this season and posted good shot-share percentages, but maybe didn’t get the results desired by the coaching staff

Below are the line combinations, including each trios time spent together at even-strength this season, along with their shot-share metrics (score adjusted) and actual results as captured by their goals-for percentage. More details can be provided in the appendix. Starting off with the top six.

5v5 TOI CF% FF% xGF% GF%
Draisaitl-McDavid-Kassian 399.25 47.66 46.51 47.93 57.40
Neal-RNH-Chiasson 103.47 59.38 58.41 60.79 50.00

The top line is one where the underlying numbers have been poor all season for the trio, but the results have been very good. Ideally their possession metrics and expected goal-share is even higher, giving us some assurances that the results are sustainable. For now, we can assume their results will likely slip, but there’s that McDavid factor to take into account.

The second combination, featuring Nugent-Hopkins, Neal and Chiasson had results that were a little surprising. While the goal-share has broken even (4 GF, 4 GA), their possession numbers as captured by their Corsi For% of 59.38% has been excellent. What’s interesting is that it was their on-ice save percentage that pulled down their goal-share, as their expected rate of goals-for (2.38) was very close to their actual rate of goals (2.32). The only caveat with this line is that they did see a higher share of offensive zone face-offs, which might be fine considering the next two line combinations spent more time starting in their own zone.

5v5 TOI CF% FF% xGF% GF%
Khaira-Sheahan-Archibald 90.08 54.19 52.22 48.26 26.23
Granlund-Haas-Russell 64.75 59.36 62.25 64.94 50.00

These results were surprising to me. In just under 100 minutes at even-strength, the combination of Khaira, Sheahan and Archibald posted a Corsi For percentage of 54%. Unfortunately, they weren’t able to convert their time with the puck into actual scoring chances as measured by expected goals, but it was still impressive considering how often Sheahan starts in his own zone. I wouldn’t trust this line to be a shut down line, but they should be able to match-up well against the other team’s bottom six and prevent bad things from happening.

The last line is the one I’m really curious about in a larger role. The trio has only played an hour together at even-strength, but they’ve been quite effective supporting the puck and just being in good spots at both ends of the rink. I assumed their Corsi For% and expected goal-share would have been fine, maybe around break even. Just didn’t think it would be above 55%.

What I especially like about the bottom six here is that the team has two players who have played center on each line that can split centermen duties depending on what side and what end of the ice they’re on. It was interesting to hear Tippett address faceoffs in his media availability when asked about Haas and Sheahan on a line together tonight.

Those two will flip back and forth depending on where the draw is, left side or right side. So they’ll both get a little bit of a look that way. Both are smart players, they can adapt to the other.

I’ve actually done a bunch of that stuff before way back to some world championships with a lot of players where centermen if you got a right side guy and a left side guy on a line it really gives you an advantage to your percentages in your own end especially. That’s the thinking behind there. Source: Edmonton Oilers

Going to back to an earlier point about chances for and against, over the last ten games the Oilers have posted an expected goals for percentage of 43.50% (30th in the league), generating 1.98 expected goals per hour, and allowing 2.57 expected goals per hour. Keep in mind, league average rates over the last three seasons is 2.25 for both metrics so the Oilers are very far from reasonable rates.

Below are how the proposed line combinations have done in their time together this season at even-strength when it comes to the rate of expected goals.

5v5 xGoals For/60 xGoals Against/60 xGF%
Draisaitl-McDavid-Kassian 2.72 2.96 47.93
Neal-RNH-Chiasson 2.43 1.57 60.79
Khaira-Sheahan-Archibald 1.87 2.00 48.26
Granlund-Haas-Russell 2.82 1.52 64.94

All four line combinations have posted an expected goals-for share above their teams recent share. Three of the four line combinations have posted an expected goals-for per hour rate above what the Oilers have posted recently and closer to league average rates. And three of the four lines post an expected goals against rate below what the Oilers have recently posted and league average rates.

Again – these potential line combinations won’t win championships, but they have results this season that indicate that they can help the Oilers improve their chances of outscoring opponents today. The team is still in need of talent up front and could use more speed and finishing skill. Those issues aren’t likely to be addressed anytime soon, and it doesn’t appear that the young prospects will get a look either. But for now, the Oilers can use their present roster to help improve their share of shots and chances and bring their underlying numbers back to respectable levels. They’ll need any edge they can find to hold on to a playoff spot.

Data: Natural Stat Trick

Appendix 1: Line combinations details

5v5 TOI CF% FF% xGF% GF% On-Ice SH% On-Ice SV% PDO Off. Zone FO%
Draisaitl-McDavid-Kassian 399.25 47.66 46.51 47.93 57.40 13.03 91.97 1.050 50.38
Neal-RNH-Chiasson 103.47 59.38 58.41 60.79 50.00 6.95 90.23 0.972 63.93
Khaira-Sheahan-Archibald 90.08 54.19 52.22 48.26 26.23 4.67 85.30 0.900 33.33
Granlund-Haas-Russell 64.75 59.36 62.25 64.94 50.00 6.69 90.72 0.974 43.33


Sliding

22316220.jpg

The Oilers are sliding, and they shouldn’t be surprised.

The good news is that the Oilers currently rank second in the Pacific with 40 points, and fifth in the Western Conference. The problem is their overall results aren’t good enough, especially at even-strength, and they’ve been trending downwards for a while.

20191213 - Goal differential

While the powerplay and penalty kill continues to thrive, it’s the even-strength (5v5) play that is dragging down the Oilers overall results. Below is the cumulative total of goals-scored, which now sits at -12 – a goal-share of 45.77%, good for 26th in the league.

20191213 - Goal differential at 5v5.png

The underlying shot-share numbers have been poor, and appear to be getting worse. While they did show some signs of life only a few weeks ago, their overall play has been declining ever since. I wrote last week that I think it had to do with the team potentially trying to generate more offence by focusing less on defensive play, but that’d be something only the coach could confirm.

Point % CF% FF% xGF% GF% SH% SV% PDO
0.588 47.88
(26th)
48.43
(22nd)
48.90
(22nd)
45.77
(26th)
8.54 90.68 0.992

Below are the Oilers Corsi For%, Fenwick For% and xGoals For% over rolling 10-game segments this season. A glossary describing the metrics can be found below.

20191213 - Shot share at 5v5

The last ten games have been extremely poor, with the Oilers posting shot-share metrics well below league average levels. The expected goal-share has slid down to 45.0%, which again might be due to the team taking more risks in an attempt to generate offence. The Oilers were doing something right early on, but it appears they’ve adjusted their tactics in an attempt to generate offence.

The other concerning issue is the team’s performance at even-strength both with and without McDavid this season. In year’s past, we would see all the shot-share numbers be above at least 51.0% with their best player on the ice. This year, it’s been a different story, as the Oilers even with McDavid have posted shot-share numbers below 50.0%.

20191213 - WOWY 97.png

The good news is that the overall goal-share has been outstanding with McDavid. But it does make you wonder how much better his on-ice goal-share and point totals would be if the Oilers were spending less time in their own zone and more time with the puck. The lack of skill on the roster, combined with a blueline that has only a few puck-movers, is what I think is driving the shot-share numbers downward.

The last ten game have been especially concerning, with the whole team including McDavid struggling to generate offence and spending more time defending. Below we see that the shot-share metrics are closer to the 45.0% percent range (!), with the goal-share being below the break-even mark even with McDavid.

20191213 - WOWY 97-10

The Oilers have posted a -1 goal differential with McDavid, and a -12 goal differential without him over the last ten games. Not even the special teams can bail them out as the outstanding powerplay has scored ten goals (and allowed one) over the last ten, while the penalty kill has actually struggled allowing six goals.

Can’t say their current results are too surprising as the team lacks skill and depth, and their shot-share metrics have been below average for most of the season. The question again comes back to the Oilers management and how they view the overall results and where the team has been trending.

With the team having accumulated 40 points, does management think the results are real and sustainable? Or do they recognize that they’re lacking a significant amount of skill and depth in all positions, and start to add pieces, either from their own development system or through the trade market. Thinking heading into the season that this was going to be a development year, and based on their actual results and underlying trends, I would expect the team to hold off on making any drastic changes and start to give some of the younger prospects a chance to play in Edmonton and further their development.

It would have been nice if the team took a positive step and posted underlying numbers that demonstrated sustainability. But the reality is that they’re not good enough to compete for a championship and should be using this season to properly evaluate the prospects that they do have.

Data: Natural Stat Trick

Also, I made an appearance on CBC Radio Active this week. Will post the link when it’s available: CBC Radio Active (2019, December 11)

Glossary

  • Corsi For percentage (CF%) – The proportion of all the shot attempts the team generated and allowed that the team generated (i.e., Corsi For/(Corsi For + Corsi Against). This is used as a proxy for possession and can predict a team’s future share of goals (GF%).
  • Fenwick For percentage (FF%) – The proportion of all the unblocked shot attempts the team generated and allowed that the team generated (i.e., Fenwick For/(Fenwick For + Fenwick Against). This is used as a proxy for shot quality and considers shot blocking a repeatable skill. It can also predict a team’s future share of goals, slightly better than Corsi.
  • Expected Goals For percentage (xGF%) – This is a weighting placed on every unblocked shot based on the probability of the shot becoming a goal. This depends on the type of shot, location and uses historical shot and goals data to come up with the probability for each unblocked shot.
  • Goals For percentage (GF%) – The proportion of all the goals that the team scored and allowed that the team generated (i.e., Goals For/(Goals For + Goals Against).
  • Shooting percentage (SH%) – The percentage of the team’s shots on goal that became goals (i.e., total goals divided by the total shots on goal).
  • Save percentage (SV%) – The percentage of the team’s shots on goal against that were saved (i.e., 1-(totals goals allowed divided by the total shots on goal against))
  • PDO – The sum of a team’s shooting percentage (SH%) and its save percentage (SV%). It’s based on the theory that most teams will ultimately regress toward a sum of 100, and is often viewed as a proxy for how lucky a team is. (Source)

Picking up the pace

Mikko-Koskinen-Edmonton-Oilers-Connor-Brown-Ottawa-Senators.jpg

While the special teams continues to produce, the Oilers even-strength (5v5) play remains an area for concern. Of the 11 teams that currently have a point percentage of 0.600 or above, only the Oilers have an even-strength goal-share below 50.0%, sitting 23rd overall with a 47.20% goal-share and a goal-differential of -7. Over the last three seasons, only two teams have finished their season with a 0.600 point percentage and a goal-share of less than 50.0%.

What’s encouraging is that it appears the Oilers are at least trying to generate more offence. What we know about this team based on their overall shot metrics is that while they don’t generate a lot of shot attempts (Corsi), they do appear to be more focused on getting quality chances as reflected by the expected goal metric (Source: Charting Hockey).

ELMLudsWwAEH05j

Here we see that while the Oilers are below the league-wide average of Corsi pace, which is at around 111 total shot attempts (for and against) per hour, they are above average when it comes to the total expected goals (for and against) per hour (4.70). Currently, the Oilers generate 2.26 expected goals per hour, good for 14th in the league. And allow 2.31 expected goals against, which is ninth highest in the league.

What’s interesting is that the Oilers do appear to be trying to play with more pace as their total rate of shot attempts for and against have been gradually increasing, and are having an impact on their rate of scoring chances (as reflected by expected goals) at both ends of the rink. Below is the Oilers rate of shot attempts (Corsi) per hour as well as their rate of expected goals (xG) per hour, over rolling 10-game segments. Note again that the rates includes events for and against.

Pace - 20191207.jpg

Couple things to note here. Starting with their Corsi/60 represented by the blue line, the Oilers were at and around the league average of 111 events per hour at the start of the season as they generated one of the lowest rates in the league and didn’t allow a lot either. However over the last ten games, they’ve moved up in the league, generating more shot attempts, getting closer to league average rates, but also allowing a lot more. And it appears playing with more pace has increased the rate of expected goals for and against, as represented by the orange line. If we go back to Charting Hockey’s pace graph at the top of the article, the Oilers would be moving from the top left quadrant (“Few but dangerous shots”) to the top right quadrant (“Fun”), clustered with Vegas and Washington.

Unfortunately for the Oilers, the increased pace of play as represented by Corsi and expected goals hasn’t improved their overall share of expected goals. Over the last ten games, the Oilers expected goal-share sits at 47.66%, indicating that their new approach of allowing more shot attempts to potentially create more offensively isn’t working very well. And their actual results at even-strength reflect that as well as they’ve posted a 40.82% goal-share over the last 10 games.

Pace xGoals - 20191207

At his pre-game media availability on Friday, Tippett may have alluded to his team gradually taking more chances, but I’d be interested to know from him if their shot-based metrics were a result of adjusted tactics or if there were other factors such as injuries to RNH and Kassian and the ensuing line combinations at play here. It’ll also be interesting to track games 31-40 to see if they slow down their pace again, aligning with what they were generating and allowing in terms of shot attempts over the first ten games of the season.

You have to take some chances to get back in the game, but the chances we are taking…they aren’t giving us any advantage and we are giving up goals. We have addressed those things the past couple of days. Source: Edmonton Oilers

When I did recently see the uptick in shot attempts and chances against, I did write the following:

The concern I would have with the team as a whole giving up more chances (potentially in an attempt to create more offensively) is that their goaltending remains a little suspect, especially with Mike Smith still getting plenty of playing time. He currently ranks in the bottom five among 38 goalies (>500 minutes) when it comes to save percentage and goals-saved above average.

And that does appear to be the case. Below is the Oilers team save percentage over rolling ten game segments.

Pace Saves - 20191207

As the shot attempts and chances against have gradually increased over the course of the season, the team save percentage has gradually declined. As much as I’d like to, I can’t say for sure that it’s just the goalies that can’t handle the workload. I suspect that playing with more pace also exposes the Oilers lack of skill, speed and depth on the roster. Again, it’s something that Tippett might have an explanation for, if in fact he has been trying to play with more pace.

Data: Natural Stat Trick, Charting Hockey

Related: Rolling along – The SuperFan (2019, November 27)

Tracking the Pacific Division – As of November 30, 2019

cut.jpg

The Oilers have continued rolling along, ranked first in the Pacific division with 35 points and a 0.625% point percentage. Vancouver did actually have a better point percentage at the end of October, but struggled in November going 5-7-3, with a 0.433 point percentage (fifth worst in the league). The Oilers meanwhile posted a 0.571 point percentage (14th in the league), with division rivals San Jose (0.733) and Arizona (0.594) doing better.

Below are the division results at even-strength (5v5) as of November 30, 2019, with teams sorted by point-percentage. For each of the shot-share metrics, I’ve applied a basic heat-map to show which teams are doing well compared to the division teams and which are struggling.  A description of each metric is at the end of this article.

Pacific - 20191130

Couple thoughts:

  • The big red-flag is the Oilers 49.14% goal-share (GF%) at even-strength. The good news: the rest of the Pacific division teams aren’t posting very good results at even-strength either, except Arizona. You can also see why some may feel that the Oilers should be all-in this season, potentially giving up future assets to make a playoff run in 2020.
  • While the Oilers expected goal-share has remained steady since the end of October (49.87%), their Corsi For% and Fenwick For% has declined slightly, now sitting below 49.0%. I recently looked into the rolling 10-game trends, and found that it’s not all on the depth players this time. Good news is that they were showing signs of progress in terms of shot-share, but it remains to be seen if they can sustain it.
  • Arizona is likely declining, as their Corsi For percentage in November was one of the worst in the league (44.63%, 29th overall), as well as their share of expected goals (44.67%). I don’t expect their goal-share to remain above 54%.
  • I originally thought Vegas was the team to watch, and they still are considering their strong underlying numbers. But San Jose did make a nice bounce-back in November going 11-4-0, and gradually improving their Corsi For% from 47.96% at the end of October to 50.29% at the end of November. Their goaltending is what might holds them back as it remains one of the worst tandems in the league.
  • Vancouver continues to do well in terms of shot-share, ranking 9th in the league when it comes to Corsi For% and 11th overall when it comes to expected goal-share. They lost some ground in November thanks to one of the worst team shooting percentages in the league. They’re probably due for a run.
  • We know how good the Oilers have been on special teams, but it’s worth noting that the Golden Knights, Canucks and Sharks are excelling as well – all four Pacific division teams are in the top eight league-wide. Below are the Pacific division teams and their combined goal rates on the powerplay and penalty kill (i.e., PP GF/60 – PP GA/60 + PK GF/60 – PK GA/60). League average is near zero with Boston leading the way with +5.7. Los Angeles is third worst in the league (heh) only ahead of New Jersey (-4.97) and Detroit (-6.18).
Team Special Teams
Combined Goal Rates
Edmonton 5.08
Vegas 4.09
Vancouver 3.90
San Jose 3.26
Arizona -0.89
Calgary -1.27
Anaheim -4.17
Los Angeles -4.54

Data: Natural Stat Trick

Glossary:

  • Points-percentage (Point%) – The total points accumulated divided by the points that were available, including extra time.
  • Corsi For percentage (CF%) – The proportion of all the shot attempts the team generated and allowed that the team generated (i.e., Corsi For/(Corsi For + Corsi Against). This is used as a proxy for possession and can predict a team’s future share of goals (GF%).
  • Fenwick For percentage (FF%) – The proportion of all the unblocked shot attempts the team generated and allowed that the team generated (i.e., Fenwick For/(Fenwick For + Fenwick Against). This is used as a proxy for shot quality and considers shot blocking a repeatable skill. It can also predict a team’s future share of goals, slightly better than Corsi.
  • Shots For percentage (SF%) – The proportion of all the shots on goal that the team generated and allowed that the team generated (i.e., Shots For/(Shots For + Shots Against).
  • Expected Goals For percentage (xGF%) – This is a weighting placed on every unblocked shot based on the probability of the shot becoming a goal. This depends on the type of shot, location and uses historical shot and goals data to come up with the probability for each unblocked shot. This has been found to be a better predictor of future goals than Corsi and Fenwick.
  • Goals For percentage (GF%) – The proportion of all the goals that the team scored and allowed that the team generated (i.e., Goals For/(Goals For + Goals Against).
  • Shooting percentage (SH%) – The percentage of the team’s shots on goal that became goals (i.e., total goals divided by the total shots on goal).
  • Save percentage (SV%) – The percentage of the team’s shots on goal against that were saved (i.e., 1-(totals goals allowed divided by the total shots on goal against))
  • PDO – The sum of a team’s shooting percentage (SH%) and its save percentage (SV%). It’s based on the theory that most teams will ultimately regress toward a sum of 100, and is often viewed as a proxy for how lucky a team is. (Source)

The SuperFan Podcast – Episode 9 – Minnia Feng

3000by3000 (1)This week on the podcast, I was joined by Minnia Feng, writer for The Athletic. Minnia and I chatted about the Oilers progress this season, areas for optimism and skepticism. We talked about how the fan experience in hockey compares to other leagues, including Minnia’s experience writing about other sports. We also discussed the changing relationships between professional players and coaches, and the evolving power dynamics between the two.

Full segment below:

Podcast channels:

Music: Anitek. “Show me.” Anitek Instrumentals Vol. 4, 2010. Jamendo.com