With special teams being such a driving factor behind the Oilers success this season, it’s important to put things into perspective and get a sense of just how much of the game is played on the powerplay and penalty kill, and what share of the total goals are scored there.
The harsh reality is that despite a fifth-ranked 0.673 points percentage, the Oilers aren’t very good at even-strength having posted only a 50.86% goal-share, ranking 16th in the league. Over the last three seasons, nine of the ten teams that had a points percentage greater than 0.600 posted a goal-share of 52.0% or more at even-strength. And ten of the last twelve teams that made it to the conference final series had a goal-share of 52.0% or more in the regular season at even-strength. That’s probably a fair target for any team that wants to be a legitimate contender.
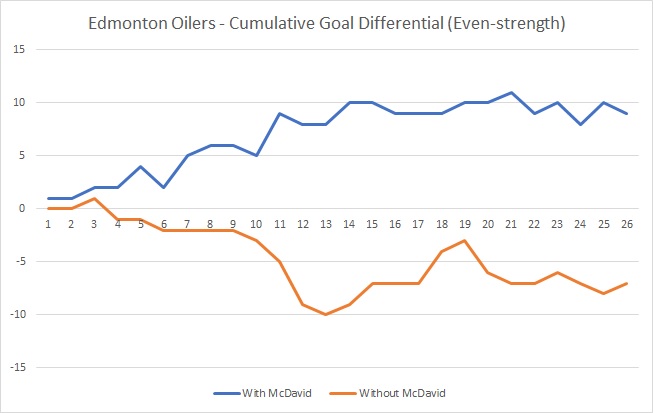
The big issue remains the Oilers depth scoring at even-strength – basically the team’s offensive output when McDavid isn’t on the ice. Right now, the Oilers are close to pretty much giving back the goals that McDavid and the top line are generating, which is unfortunate considering the seasons he and Draisaitl are having. With McDavid, the Oilers have a 57.63% goal-share, and without him the Oilers have a 44.26% goal-share.
Currently, the Oilers only have a +2 goal-differential (59 goals for, 57 goals against) at even-strength, making it even more important that the Oilers continue excelling both on the powerplay (currently scoring 12.53 goals for per hour, 2nd overall) and the penalty kill (currently allowing 4.24 goals against per hour, 2nd overall).
In the three regular seasons prior to the current one, teams played on average 8.20% of their total time on the powerplay (which also means the same average time percentage exists for penalty kill), with 23% of the total goals scored league-wide occurring on special teams. After 26 games, the league average time spent on the powerplay is 8.90% with the Oilers ranking second last in the overall with 7.27%. Despite that, they have scored 24 of their 83 totals goals on the powerplay (28.9%), thanks in large part to a league-leading 21.05% team shooting percentage.
The big question is if they can continue generating on the powerplay at a rate that will prop up their overall goal-differential. One way to determine if the results on the powerplay are real or not is to take a look at the teams ability to generate unblocked shot attempts (i.e., Fenwick, also a proxy for scoring chances). I tend to use Fenwick to take into account the act of blocking shots, which is a standard tactic for penalty kill units. In my mind, good powerplay units find lanes and get shots through, which can be captured by the Fenwick metric.
The Oilers currently rank third in the league when it comes to generating unblocked shot attempts on the powerplay with 85.07. Over the last three regular seasons, teams generated on average 74.80 unblocked shot attempts, putting the Oilers in elite company as only five teams over the last three seasons have generated more than 85.0 unblocked shot attempts per hour in a season.
What’s promising is that the Oilers have remained consistent throughout this season in generating chances, thanks to their high-end talent remaining healthy. The current league average of 71.84 is represented by the orange line.

The concern of course will be if the Oilers can maintain a 21.05% shooting percentage on the powerplay, which we should expect to fluctuate over the course of the season. The average team shooting percentage over the last three seasons has been 13.3%, with only one team finishing a season with a shooting percentage above 20.0%.
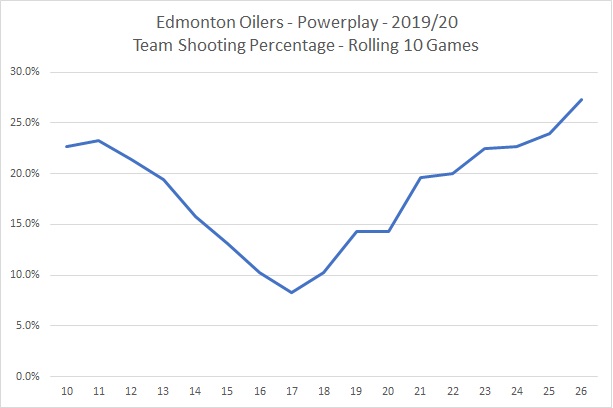
The Oilers did see a dip in their shooting percentage earlier this season, but have bounced back nicely shooting over 25.0% on the powerplay over the more recent ten game segment. We can absolutely expect the shooting percentage to drop – it’s already happened – but I don’t think it’s out of the realm of possibility that the team finishes well above the league average rate considering the high-end talent the Oilers currently have.
One other note.
WheatNOil posted an interesting metric (Macaroni!) that captured a team’s special teams output, combining the rate of goals scored for and against on the powerplay and penalty kill (i.e., PP GF/60 – PP GA/60 + PK GF/60 – PK GA/60). Not susprisingly, the Oilers currently rank near the top of the league.
Out of curiosity, I replicated Wheat’s method for the last three seasons combined to see how it roughly correlates with a team’s points percentage. Below are the results, sorted by the Special Teams combined goal rates. I also included each team’s goal-share (GF%) at even-strength.
| Team (2016-2019) | Points % | Special Teams – Combined Goal Rates | Even-strength GF% |
| Tampa Bay Lightning | 0.681 | 2.93 | 54.50 |
| Boston Bruins | 0.638 | 2.53 | 53.71 |
| Toronto Maple Leafs | 0.610 | 1.69 | 52.77 |
| Pittsburgh Penguins | 0.632 | 1.60 | 53.09 |
| Washington Capitals | 0.665 | 1.17 | 55.46 |
| Florida Panthers | 0.535 | 1.13 | 47.01 |
| San Jose Sharks | 0.610 | 1.13 | 51.42 |
| Vegas Golden Knights | 0.616 | 1.06 | 52.83 |
| Minnesota Wild | 0.589 | 0.94 | 51.80 |
| Winnipeg Jets | 0.610 | 0.93 | 52.61 |
| Calgary Flames | 0.579 | 0.53 | 51.51 |
| New York Rangers | 0.522 | 0.41 | 48.08 |
| New Jersey Devils | 0.486 | 0.33 | 44.67 |
| Nashville Predators | 0.632 | 0.31 | 54.49 |
| Anaheim Ducks | 0.581 | 0.21 | 50.56 |
| Los Angeles Kings | 0.518 | 0.00 | 49.05 |
| St Louis Blues | 0.593 | 0.00 | 52.04 |
| Carolina Hurricanes | 0.547 | -0.13 | 48.31 |
| Columbus Blue Jackets | 0.616 | -0.23 | 53.91 |
| Buffalo Sabres | 0.439 | -0.49 | 42.71 |
| Colorado Avalanche | 0.474 | -0.52 | 46.72 |
| Edmonton Oilers | 0.528 | -0.75 | 49.18 |
| Dallas Stars | 0.537 | -1.01 | 50.50 |
| Arizona Coyotes | 0.459 | -1.11 | 44.95 |
| Montreal Canadiens | 0.549 | -1.27 | 50.67 |
| Ottawa Senators | 0.465 | -1.48 | 45.49 |
| New York Islanders | 0.563 | -1.65 | 51.19 |
| Vancouver Canucks | 0.453 | -1.88 | 45.29 |
| Detroit Red Wings | 0.459 | -2.01 | 45.61 |
| Philadelphia Flyers | 0.545 | -2.10 | 49.14 |
| Chicago Blackhawks | 0.547 | -2.52 | 50.56 |
The team’s with the best combined special teams often did well overall, with eight of the ten teams posting a points percentage above 0.600 (which would have them comfortably top ten in the league). That’s not exactly ground-breaking information – if you’re killing it on both special teams, you’re improving your chances of finishing the season well. What does stand out is that of those top ten clubs that had solid special teams, seven also posted a goal-share of 52.0% or more at even-strength. Again, nothing earth shattering, but it does confirm that if the Oilers want to finish in the top half of the league, they can rely all they want on special teams, but they also need their even-strength goal-share to be better. Might be something worth digging into more, but at least it sets up a few reasonable targets to track as the season progresses.
Data: Natural Stat Trick

Pingback: Rolling along | The SuperFan
what the even strength goal share of the 2nd, 3rd, 4th lines compared to the same goal share of the other top 10 teams. Present it as a rate ratio. This will tell us how far are we behind the other teams on our other lines?
I understand we pay for McDrai, and get production from those dollars. But there are oppoutunities for strategic improvement elsewhere.
How much money will we need to spend on lines 2-4 to make a meaningful difference?
Who is available for that kind of money?
Pingback: Special teams tracking | The SuperFan