While the Edmonton Oilers aren’t having the greatest season, the good news is that most of the Pacific division is struggling as well. Six of the eight teams have a negative goal-differential at this point, with only Vegas and Seattle leading the pack. Worth noting too that four of the eight teams in the Central division are also posting negative goal-differentials, with only Dallas, Winnipeg and Colorado having solid seasons so far.
| Team | Record | Points | Point % | Goal differential |
| Vegas | 17-6-1 | 35 | 0.729 | +20 |
| Seattle | 14-5-3 | 31 | 0.705 | +16 |
| Edmonton | 13-10-0 | 26 | 0.565 | -3 |
| Los Angeles | 12-9-4 | 28 | 0.560 | -5 |
| Calgary | 10-9-3 | 23 | 0.523 | -3 |
| Vancouver | 9-11-3 | 21 | 0.457 | -8 |
| San Jose | 8-14-4 | 20 | 0.385 | -15 |
| Anaheim | 6-15-2 | 14 | 0.304 | -37 |
Despite their issues, the Oilers are still posting the third best points percentage in their division, largely driven by their powerplay which generates the third highest rates of goals per hour in the league. Everything else – even-strength play and results, their penalty kill, their goaltending – it all needs work if they want to qualify for the playoffs.
Below are the even-strength (5v5) numbers for each team in the Pacific division (sorted by points percentage) including goal-share results as well as the shot-share metrics that gives us a sense of which teams have the right processes in place and if the results are sustainable or not. I’ve also applied a basic heat-map to show which teams are doing well or struggling relative to their division foes. You can find a description of each metric at the end of this article. Also note that the shot-share metrics are score and venue adjusted based on Natural Stat Trick’s methodology.

Not much has changed for the Oilers since the last check-in at the end of October other than the goal-share dropping significantly, something that was expected considering their shot-share numbers and expected goal-share had been below average and some of the lowest in the division. And these numbers are still poor after 23 games, putting the Oilers at risk of losing ground to the Los Angeles and Calgary who are both posting some of the strongest Corsi for percentages and expected goal shares in the league. Issue for both teams is currently goaltending, which has somehow been worse than Edmonton’s, and it could sink their playoff chances if it doesn’t get sorted out. I’m also curious to see if Seattle’s powerplay, which currently ranks 7th in the league in terms of goals per hour, can continue to drive their overall results. They currently generate some of the lowest rates of shots and scoring chances on the powerplay, so I’m expecting things to cool off.
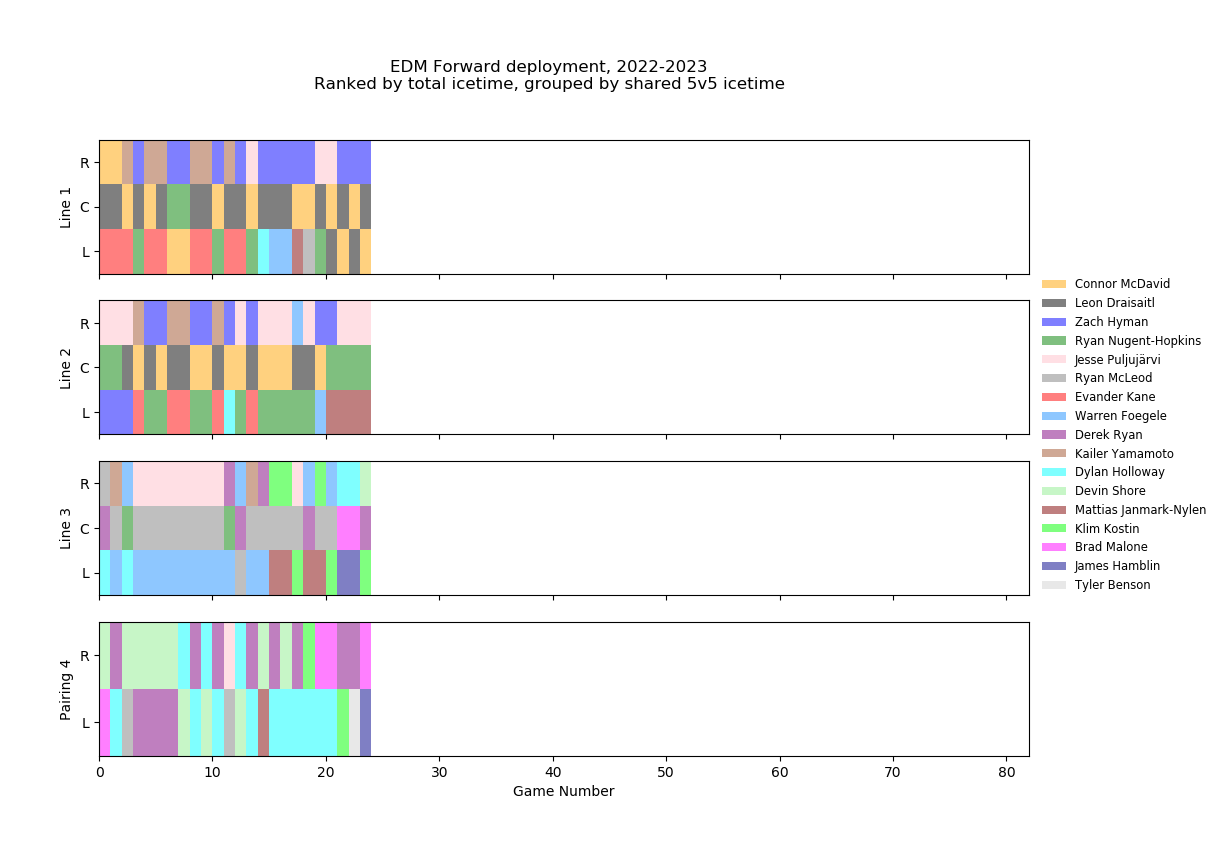
Back to the Oilers – it seems like the best idea that the coaching staff could think of to improve their 5v5 results (and to get Draisaitl going) is just putting McDavid and Draisaitl together on the ice as much as possible. In the first 19 games of the season, the duo only played 60 minutes together – or about 6.5% of the team’s total ice time. That’s still higher than what I was expecting considering they rarely played together after Woodcroft took over last season, but lower nonetheless. Over the last five games, however, McDavid and Draisaitl have played 69 minutes together – or about 29% of the team’s total ice time. In that time, the Oilers have posted a Corsi for percentage and expected goals for percentages closer to 60% and outscored opponents 5-3. Not sure how sustainable this is with both players averaging more total ice time per game, but it feels like the coaching staff is out of ideas and doing what they know will work. The concern of course will be the rest of the roster and if they can post positive shot-share metrics and goal differentials at 5v5 without their star players on the ice. Definitely something worth monitoring over the next month.
Data: Natural Stat Trick, Hockey Viz
Glossary:
- Points-percentage (Point%) – The total points accumulated divided by the points that were available, including extra time.
- Corsi For percentage (CF%) – The proportion of all the shot attempts the team generated and allowed that the team generated (i.e., Corsi For/(Corsi For + Corsi Against). This is used as a proxy for possession and is the best at predicting a team’s future share of goals (GF%). (Source: Hockey Great Tapes – Draglikepull)
- Fenwick For percentage (FF%) – The proportion of all the unblocked shot attempts the team generated and allowed that the team generated (i.e., Fenwick For/(Fenwick For + Fenwick Against). This is used as a proxy for shot quality and considers shot blocking a repeatable skill.
- Expected Goals For percentage (xGF%) – This is a weighting placed on every unblocked shot based on the probability of the shot becoming a goal. This depends on the type of shot, location and uses historical shot and goals data to come up with the probability for each unblocked shot.
- Goals For percentage (GF%) – The proportion of all the goals that the team scored and allowed that the team generated (i.e., Goals For/(Goals For + Goals Against).
- Shooting percentage (SH%) – The percentage of the team’s shots on goal that became goals (i.e., total goals divided by the total shots on goal).
- Save percentage (SV%) – The percentage of the team’s shots on goal against that were saved (i.e., 1-(totals goals allowed divided by the total shots on goal against).

Pingback: Dispirit | The SuperFan
Pingback: Tracking the Pacific division – As of December 31, 2022 | The SuperFan