The Oilers are off to an okay start to the 2022/23 regular season, having struggled at home in their first six games, but then getting great results on the road winning three games in four nights.
Here’s what the Pacific division looks like at this point, sorted by points percentage.
| Team | Record | Points | Point % | Goal differential |
| Vegas | 8-2-0 | 16 | 0.800 | +15 |
| Calgary | 5-2-0 | 10 | 0.714 | +4 |
| Edmonton | 6-3-0 | 12 | 0.667 | +8 |
| Los Angeles | 5-5-0 | 10 | 0.500 | -6 |
| Seattle | 4-4-2 | 10 | 0.500 | -1 |
| Vancouver | 2-5-2 | 6 | 0.333 | -7 |
| Anaheim | 2-6-1 | 5 | 0.278 | -18 |
| San Jose | 3-8-0 | 6 | 0.273 | -10 |
Edmonton is right where they have to be – a points percentage above 0.650 and top three in the division. The powerplay is once again the main driver for their overall success, but the goaltending at even-strength has also been a factor.
The rest of the division, and the conference for that matter, isn’t looking all that threatening at this point. Only two teams in the entire eastern conference have a negative goal-differential (Toronto and Columbus), while five teams in the Pacific and four teams in the Central division are in the red. Early days obviously, but the path to the cup in the west doesn’t seem as daunting as it does in the east.
Below are the even-strength (5v5) numbers for each team in the Pacific division (sorted by points percentage) including goal-share results as well as the shot-share metrics that gives us a sense of which teams have the right processes in place and if the results are sustainable or not. I’ve also applied a basic heat-map to show which teams are doing well or struggling relative to their division foes. You can find a description of each metric at the end of this article. Also note that the shot-share metrics are score and venue adjusted based on Natural Stat Trick’s methodology.
I’ve also included each team’s results on special teams, combining the goals for and against on the powerplay and penalty kill, as well as the total shots.
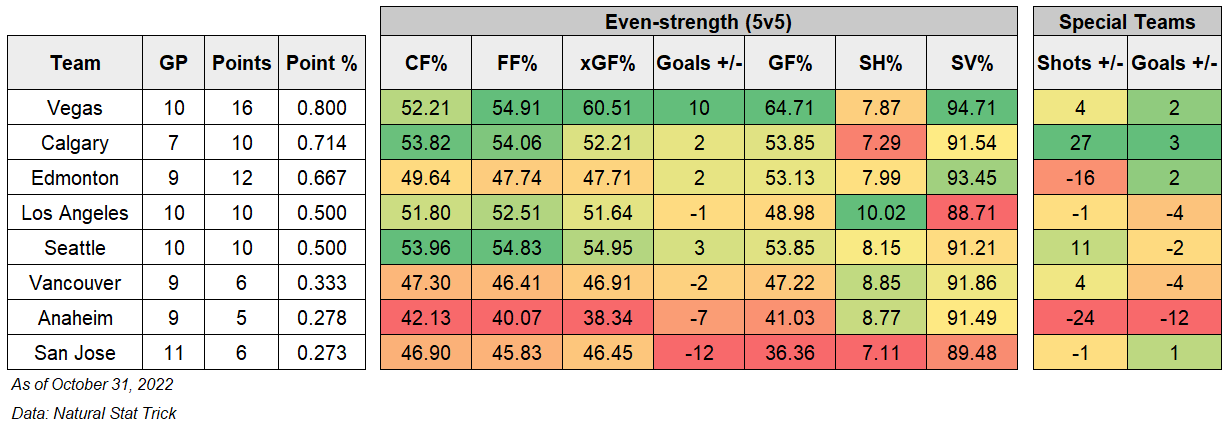
Looking at the even-strength numbers first, we see that while the Oilers are getting decent results, they only have a +2 goal differential and their underlying shot share numbers indicate the success may not be sustainable. Their Corsi For% of 49.64% ranks 19th in the league, while their expected goals for percentage of 47.71% ranks 20th and ahead of only Vancouver and Anaheim in the Pacific. That’s significantly lower than what the Oilers posted in the 38 games Woodcroft coached last season, so I’m expecting these numbers to gradually improve.
The Oilers are getting excellent goaltending thanks to young Stuart Skinner, who ranks first among the 55 goalies who have played at least 100 minutes with a 0.971 save percentage and fourth with a +5.79 goals saved above average (GSAA). He ranks well alongside some pretty good goalies, so hopefully he can sustain above-average numbers as the season progresses. Campbell on the other hand hasn’t been as sharp, something that was expected heading into the season, as he ranks 41st among the 55 goalies in terms of save percentage with 0.905 and 40th with a -1.29 GSAA
| Rank (GSAA) | Player | Team | GP | TOI | SV% | GSAA |
| 1 | Connor Hellebuyck | WPG | 7 | 340 | 0.947 | 6.58 |
| 2 | Carter Hart | PHI | 6 | 271 | 0.952 | 6.03 |
| 3 | Jake Oettinger | DAL | 7 | 296 | 0.957 | 5.83 |
| 4 | Stuart Skinner | EDM | 4 | 178 | 0.971 | 5.79 |
| 5 | Alexandar Georgiev | COL | 6 | 290 | 0.949 | 5.19 |
| 6 | Logan Thompson | VGK | 6 | 285 | 0.954 | 4.99 |
| 7 | Linus Ullmark | BOS | 7 | 285 | 0.948 | 4.33 |
| 8 | Craig Anderson | BUF | 3 | 144 | 0.961 | 3.42 |
| 9 | Tristan Jarry | PIT | 6 | 281 | 0.936 | 3.19 |
| 10 | Ville Husso | DET | 5 | 230 | 0.937 | 2.73 |
Now in nine games, the Oilers have outscored their opponents at even-strength only three times, largely depending on their powerplay to bail them out. Which brings me to my next point.
The Oilers powerplay has been outstanding so far, scoring 11 goals and allowing one. With the talent they have and the history they have together, the Oilers have no issues generating high quality chances and finishing them. What is concerning is the penalty kill which has almost given back everything that this outstanding powerplay has generated. In nine games, the Oilers penalty kill has allowed ten goals and scored two, allowing a rate of 9.76 goals against per hour – sixth highest in the league. They’re also allowing the sixth highest rate of shots against per hour, an issue that has long plagued the Oilers and appears to be continuing under Woodcroft. In such a high-pressure season, the Oilers cannot afford a horrendous penalty kill, especially if their even-strength numbers remain closer to league average.
One other observation from these first nine games is how often the coaching staff is deploying McDavid and Draisaitl together at even-strength. It’s well-established the importance of having multiple scoring lines in the league, spreading the offence to overwhelm opponents. And while it’s fun having two star players on the ice together, it makes a lot more sense playing these two on separate lines and increasing the odds of out-scoring teams.
Last season after Woodcroft took over, McDavid and Draisaitl were deployed together for only 55 minutes at even-strength in the 38 games – so about 3% of the team’s total ice time. At home, they played together for about 17 minutes or 1.8% of the team’s total ice time. And on the road, they played 38 minutes together, or about 4.3% of the team’s total ice time. The consistency of having these two anchoring their own lines at 5v5 was a massive reason for the team’s results last season.
This season, for whatever reason, the coaching staff has deployed the two stars together more often – playing them for 35 minutes or about 8.5% of the team’s total ice time. And almost all of that happened at home in the first six games. Perhaps it was the closer games at home or the fact that the rest of the team was struggling that increased their ice time together. But it was interesting to see how fast the coaching staff went to this option as it does come across as panicky.
| 5v5 | Home | Away |
| 2021/22 | 1.8% | 4.3% |
| 2022/23 | 11.8% | 1.6% |
I’m expecting the coaching staff to keep these two on separate lines going forward, as it does improve the odds of outscoring opponents. The key will be keeping them separated regardless of how the season is going, which is probably a lot easier said than done. This is also the first time we’re seeing how Woodcroft will perform over the course of a full season and how he navigates losing streaks and injuries. Just hoping he sticks to his plan and overall approach instead of repeating the mistakes of previous coaches.
Data: Natural Stat Trick
Glossary:
- Points-percentage (Point%) – The total points accumulated divided by the points that were available, including extra time.
- Corsi For percentage (CF%) – The proportion of all the shot attempts the team generated and allowed that the team generated (i.e., Corsi For/(Corsi For + Corsi Against). This is used as a proxy for possession and is the best at predicting a team’s future share of goals (GF%). (Source: Hockey Great Tapes – Draglikepull)
- Fenwick For percentage (FF%) – The proportion of all the unblocked shot attempts the team generated and allowed that the team generated (i.e., Fenwick For/(Fenwick For + Fenwick Against). This is used as a proxy for shot quality and considers shot blocking a repeatable skill.
- Expected Goals For percentage (xGF%) – This is a weighting placed on every unblocked shot based on the probability of the shot becoming a goal. This depends on the type of shot, location and uses historical shot and goals data to come up with the probability for each unblocked shot.
- Goals For percentage (GF%) – The proportion of all the goals that the team scored and allowed that the team generated (i.e., Goals For/(Goals For + Goals Against).
- Shooting percentage (SH%) – The percentage of the team’s shots on goal that became goals (i.e., total goals divided by the total shots on goal).
- Save percentage (SV%) – The percentage of the team’s shots on goal against that were saved (i.e., 1-(totals goals allowed divided by the total shots on goal against).

Pingback: Tracking the Pacific division – As of November 30, 2022 | The SuperFan
Pingback: Thoughts on the Oilers: Team defence and goaltending are two separate things | The SuperFan