We’re 38 games into the regular season and the Edmonton Oilers rank fifth in points percentage in a fairly weak Pacific division. The Oilers continue to get outscored at even-strength (5v5) and rely heavily on their powerplay, which remains one of the best in the league.
Here’s how the Pacific division looks today, with the Oilers posting a 0.553 points percentage, ranking 9th in the western conference and just holding on to the first wild card spot.
| Team | Record | Points | Point % | Goal differential |
| Vegas | 25-12-2 | 52 | 0.667 | 18 |
| Los Angeles | 21-13-6 | 48 | 0.600 | -9 |
| Seattle | 18-12-4 | 40 | 0.588 | 4 |
| Calgary | 18-13-7 | 43 | 0.566 | 4 |
| Edmonton | 20-16-2 | 42 | 0.553 | 10 |
| Vancouver | 16-17-3 | 35 | 0.486 | -15 |
| San Jose | 11-20-7 | 29 | 0.382 | -26 |
| Anaheim | 10-23-4 | 24 | 0.324 | -68 |
The good news is that the Oilers overall goal differential (all situations) is now a positive number, which wasn’t the case a month ago when they were one of six Pacific division teams with a negative goal differential. In fact, their current +10 goal differential is the second best in the division – a good reminder that the Pacific is wide-open with each team dealing with their own flaws either at even-strength or special teams and when it comes to goaltending or finishing ability.
Below are the even-strength (5v5) and special teams numbers for each team in the Pacific division (sorted by points percentage) including goal-share results as well as the shot-share metrics that gives us a sense of which teams have the right processes in place and if the results are sustainable or not. I’ve also applied a basic heat-map to show which teams are doing well or struggling relative to their division foes. You can find a description of each metric at the end of this article. Also note that the shot-share metrics are score and venue adjusted based on Natural Stat Trick’s methodology.

There’s been some movement since the last time we checked in on the Pacific with Los Angeles making the most progress moving up to second from fourth, and Calgary moving from fifth to fourth. Edmonton and Seattle have fallen, while Vancouver, San Jose and Anaheim remain at the bottom. No team has really seperated themselves from the pack, including Vegas, each showing some weaknesses that they’ll need to address.
Seattle for example has been strong at even-strength – good shot-share numbers and a solid goal-differential, but their special teams and goaltending have been a big reason why they’ve fallen in the standings. The Kraken powerplay ranks 22nd in the league, generating the third lowest rate of shots and scoring chances. And their penalty kill ranks 31st, largely because of their goaltending. Vegas currently leads the Pacific but they’re just breaking even in terms of goal differential at even-strength because of their average shooting percentage and are relying heavily on special teams to bail them out. Calgary, despite some very good shot-share and puck possesion numbers at even-strength, is having trouble converting those chances into actual goals with some of their key players having down-years. And Los Angeles continues to do well in terms of shot-share and puck possession numbers, but their goaltending is one of the weakest in the league. Again, none of these clubs look like a real threat at this point. It’s really going to come down to which team aggresively addresses their issues first.
Couple things to monitor from an Oilers perspective:
- A lot of attention is on the Oilers defensive play, and for good reason. At even-strength (5v5), they allow the 11th highest rate of goals against (2.62) and the 12th highest rate of unblocked shot attempts and shots on goalagainst. Every game feels like a referendum on which player should be sent packing next depending on who makes the biggest gaffe. But what’s been overlooked, and definitely tied to the defensive play, is the Oilers lack of offence. They rank 19th when it comes to goals for per hour (2.46) and in the bottom third of the league when it comes to generating shots and scoring chances.
- The powerplay continues to be excellent, scoring 13.38 goals per hour, ranking first in the league. The success appears to be sustainable considering the talent they have up front and their ability to consistently generate scoring chances. They rank 7th in the league in unblocked shot attempts (a proxy for scoring chances) and 6th in the league when it comes to shots on goal. The Oilers also rank around league average when it comes to drawing penalties – definitely an area worth improving on. It’s a repeatable skill, so you would expect a competent scouting staff to be able to figure out how to identify these types of players, which could help drive better overall results.
- Over the last ten or so games, the Oilers penalty kill has had better results. They’ve allowed a much lower rate of goals (7.15 per hour) compared to the first 28 games (11.43, 4th highest). But it’s largely been driven by the goaltending. The team continues to allow some of the highest rates of unblocked shot attempts and shots on goals against in the league – an indicator that their results will eventually get worse. Skinner has up until this point been fine on the penalty kill, posting league average save percentage and GSAA. So I wouldn’t expect him to continue bailing out the team if they continue allowing so many chances. The penalty kill needs to do a better job at preventing zone entries and limiting chances. It’s been an ongoing issue since Woodcroft took over, and it might be worth their time to find an assistant who specializes in the area. And that’s assuming the coaching staff is paying attention to the data.
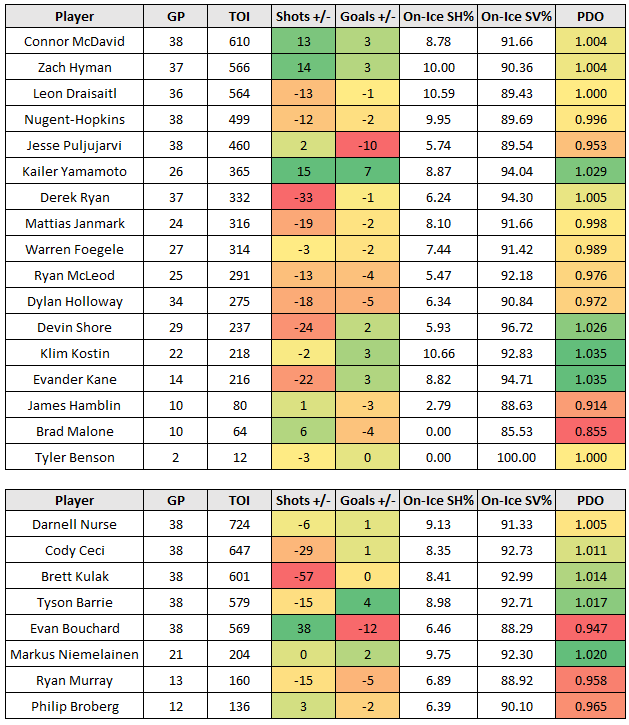
Lastly, here’s a quick snapshot of each players on-ice shot and goal-differential at even-strength, along with their on-ice shooting and save percentages to give a sense of how a player’s season might play out. One player to watch is Klim Kostin who is on a bit of a heater. He’ll definitely get lots of praise for his play and results, but it’s worth tempering expectations.
Data: Natural Stat Trick, Hockey Viz
Glossary:
- Points-percentage (Point%) – The total points accumulated divided by the points that were available, including extra time.
- Corsi For percentage (CF%) – The proportion of all the shot attempts the team generated and allowed that the team generated (i.e., Corsi For/(Corsi For + Corsi Against). This is used as a proxy for possession and is the best at predicting a team’s future share of goals (GF%). (Source: Hockey Great Tapes – Draglikepull)
- Fenwick For percentage (FF%) – The proportion of all the unblocked shot attempts the team generated and allowed that the team generated (i.e., Fenwick For/(Fenwick For + Fenwick Against). This is used as a proxy for shot quality and considers shot blocking a repeatable skill.
- Expected Goals For percentage (xGF%) – This is a weighting placed on every unblocked shot based on the probability of the shot becoming a goal. This depends on the type of shot, location and uses historical shot and goals data to come up with the probability for each unblocked shot.
- Goals For percentage (GF%) – The proportion of all the goals that the team scored and allowed that the team generated (i.e., Goals For/(Goals For + Goals Against).
- Shooting percentage (SH%) – The percentage of the team’s shots on goal that became goals (i.e., total goals divided by the total shots on goal).
- Save percentage (SV%) – The percentage of the team’s shots on goal against that were saved (i.e., 1-(totals goals allowed divided by the total shots on goal against).

Pingback: Pacific depth | The SuperFan