Disappointing end to the Oilers season but it wasn’t completely unexpected. As great as their regular season was, the Oilers were a flawed team and their late season results weren’t that significantly better than Chicago’s. Combine that with the randomness that comes with playoff hockey and the fact that there was a four month layoff between the end of the regular season and the start of qualifying round it’s hard to be too upset.
Related articles:
- Re-connecting– The SuperFan (2020, June 16)
- CBC Radio Active: NHL set to return to play – The SuperFan (2020, July 10)
- Depth perception – The Copper & Blue (2020, July 19)
- Powering up in Chicago – The Copper & Blue (2020, July 23)
- CBC Radio Active: Oilers post mortem – The SuperFan (2020, August 11)
While we can’t and shouldn’t make long term projections based on the series loss to Chicago, or ridiculous characterizations of the team and individual players, we can still highlight the actual results to see what the Oilers did well and where they struggled. Long-term projections that inform the decision-making process around roster construction always needs to rely on larger sample sizes. In this case, focus on the 2019/20 regular season results rather than four games in August.
For now, I want to focus on the results from the qualifying round.
The Oilers were outscored 16-15 by the Blackhawks, scoring five goals on the powerplay and allowing four shorthanded. At even-strength, they scored 10 goals, a rate of 3.28 goals per 60, which would rank them 6th among all teams, and 4th among teams that were playing in a qualifying round. Unfortunately, they also allowed 12 goals at even-strength, a rate of which was second highest among all teams.
The Oilers powerplay was solid, scoring five times in just under 30 minutes of ice time, a rate of 10.38 goals per hour. That’s just a hair below where they were in the regular season when they finished with a rate of 10.64 goals per hour – an outstanding rate which had them first in the league. They generated 58.13 shots per hour against Chicago, well above the regular season league average rate of 53.62 (over the last three seasons), which is around where they were in the regular season. And they converted about the same percentage of shots into goals, posting a 17.86% shooting percentage, which is slightly below their ridiculous 20.27% shooting percentage from the regular season.
The Oilers penalty kill on the other hand, was not as good as it was in the regular season. Allowing four goals in just under 30 minutes translates to a rate of 8.56 goals against per hour, well above their regular season rate of 5.15, second best in the league. A big reason for this was the amount of shots the Oilers allowed, one of the highest among all playoff teams with 64.21. The Oilers goaltenders were fine shorthanded posting a save percentage of 86.67%, which is right around the regular season league average rate of 86.59%. This was however below the Oilers league-leading save percentage of 90.61% in the regular season – not entirely surprising considering both goalies posted league average save percentages in their careers prior to this season.
Where the goalies really let the team down was at even-strength, as the Oilers posted a team save percentage of 85.88% – worst among all teams competing in the playoffs. What’s especially frustrating is that the Oilers did a pretty good job at controlling the flow of play, posting a Corsi For% of 53.52% over the four games and out-chancing the Blackhawks posting a Fenwick For% of 52.91%. And the Oilers did a decent job limiting the shots against (28.87 per hour, 7th best among all teams) and unblocked shot attempts against (a proxy for scoring chances) with 38.45 per hour, 6th best among all teams. Yes there were defensive breakdowns and missed assignments in their own zone, but the goaltending was by far the biggest issue allowing goals from low-danger areas of the ice.
Worth noting too that the Oilers goaltending at even-strength was one of the worst in the league during the regular season, ranking 25th overall with a 91.23% team save percentage. Among 54 goalies who played at least 1,000 minutes at even-strength during the regular season, Mike Smith ranked 52nd with a 90.00% save percentage and 53rd when it came to goals-saved above average (GSAA) with -16.26. Koskinen was much better and closer to league average levels ranking 21st among the group with a 92.40% save percentage and 20th in terms of GSAA with +4.53. We knew this going into the playoffs, making the decision to start Smith in game one of the series even more perplexing.
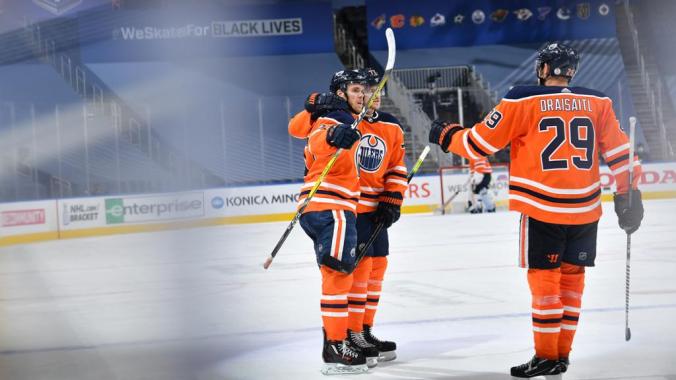
What’s also interesting is how the Oilers forward group did in the qualifying round, with coach Tippett electing to run McDavid and Nugent Hopkins as a pair on one line with rotating wingers, and Draisaitl and Yamamoto as pair on another line. Observers are fair to question why Tippett didn’t unite the trio of Draisaitl, Nugent-Hopkins and Yamamoto who posted a ridiculous 77.78% goal-share at even-strength, out-scoring opponents 28-8 in 317 minutes of ice-time in the regular season, but only played a few together against Chicago. But digging into the numbers a little more, it’s difficult to criticize Tippett when his lines actually did well against the Blackhawks, posting strong shot-share metrics, including the bottom six forwards which I was initially very skeptical about.
| Metrics | Draisaitl + Yamamoto | McDavid + RNH | Bottom six |
| TOI | 42.43 | 41.57 | 59.05 |
| TOI/GP | 10.61 | 10.39 | 14.76 |
| Corsi For% | 49.18 | 56.33 | 56.33 |
| Fenwick For% | 52.65 | 52.95 | 56.16 |
| Expected Goals For% | 60.03 | 57.86 | 59.97 |
| Goals For% | 33.33 | 37.50 | 50.00 |
| Sh% | 8.95 | 12.52 | 2.93 |
| Sv% | 81.04 | 78.37 | 95.94 |
With McDavid and RNH on the ice, (no Draisaitl or Yamamoto), the Oilers posted a Fenwick For percentage of 52.95% in about 42 minutes of ice time. And they scored 4.31 goals per hour, which is well above McDavid’s on-ice rate from the regular season (3.52 goals per hour). But due to the goaltending, and a 78.37% on-ice save percentage, they were outscored by Chicago posting a goal-share of 37.50%.
Similar thing happened when Draisaitl and Yamamoto were on the ice without McDavid or RNH. The Oilers posted a Fenwick For percentage of 52.65% in about 42 minutes of ice time with them on the ice, but only came away with a 33.33% goal-share. They struggled to score, posting a slightly below average on-ice shooting percentage of 8.95%, but it was really the goaltending that sunk them as their on-ice save percentage was 81.04%.
And in about 59 minutes of ice time at even-strength without McDavid, RNH, Draisailt or Yamamoto the Oilers bottom-six forwards posted a Fenwick For percentage of 56.16%, which is just outstanding. Unfortunately, the best they could do was score one goal. The key takeaway from all of this is that the Oilers were spending more time with the puck and keeping play in the offensive zone – all the things teams need to do to give themselves a chance to out-score opponents and win games. Reviewing the underlying shot-share metrics, it’s hard to criticize how Tippett constructed his line combinations.
While we can’t project much from the four game-series, it’s still important to look at the actual results and the underlying on-ice metrics to gauge what went well and what didn’t. It’s easy to point to the lack of “intensity”, and “leadership” and develop narratives about the Oilers needing to “learn how to win”. The challenge is to look past the noise, identify what the key issues were in the playoffs and the regular season, and act on actual facts based on coaching tactics, player performance and numbers when making roster decisions this off-season. This requires effort and courage and sound decision-making processes – and hopefully Oilers management is up for the challenge.
Data: Natural Stat Trick
Also posted at The Copper & Blue.
