Leon Draisaitl hits 100 points again thanks to his powerplay production

Scoring another two goals on Tuesday night against Ottawa, 27-year old Leon Draisaitl reached the 100 point mark for the fourth time in his career. He currently ranks third in the league this season with 44 goals and seventh overall with 56 assists.

Draisaitl now has 716 points in 624 career NHL games – and has established himself as one of the top-end forwards in the league. His productivity in the regular season and playoffs has him in some very elite company, and he’s a big reason why the Oilers are one of the highest scoring teams this season.

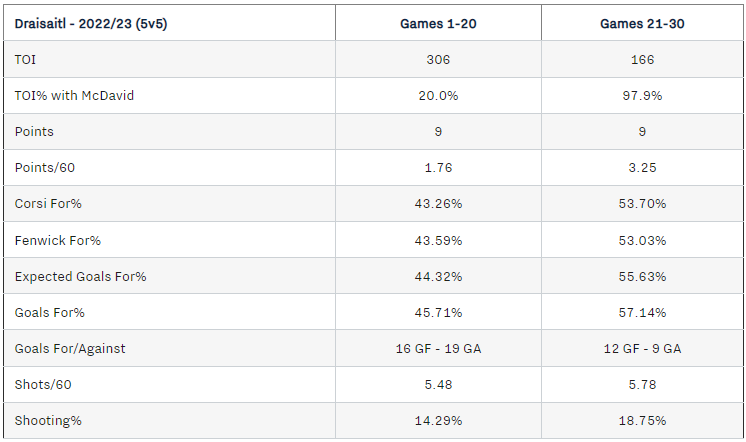
The biggest driver for his success is his productivity on the powerplay, where he currently leads the league with 27 goals and ranks tenth with 23 assists. The 50 powerplay points he’s accumulated makes up 50% of his total points, an increase from the 38% proportion he’s posted over the last three seasons. He’s having an incredible year on the powerplay, which remains one the best in the league and a significant competitive advantage. Worth noting is that while Draisaitl continues to produce well at even-strength (5v5), his scoring rate is actually down this season compared to previous seasons, currently sitting at 2.16 points per hour.

Digging into the powerplay numbers a little more, Draisaitl’s scoring rate (11.31 points per hour) has been one of the best in the league and actually one of the highest rates over the last several seasons. Only a handful of players have surpassed the 10.00 points per hour mark in a year, with the average among regular powerplay forwards being around 4.4 points per hour (based on forwards who have played at least 150 minutes over the last three seasons). Draisaitl himself has posted a rate of 8.61 points per hour on the powerplay over the last three seasons, making his current rate of scoring about 31% higher where we’d expect him to be.

There’s been a few reasons for his powerplay success this season, which has helped him reach the 100-point mark.

First, he’s been shooting at a rate almost 12% higher than where he’s been at over the last three seasons, currently sitting at 19.23 shots per hour on the powerplay. Based on some of the shots we’ve seen him take on the powerplay, it’s clear he’s got a lot of confidence in his abilities, a by-product of his experience in the league and being on a unit that has now spent a lot of time together.

Second, Draisaitl is converting a significantly higher proportion of his powerplay shots into goals, currently sitting at a 31.76% individual shooting percentage. In the last three season, Draisaitl posted a 23.50% shooting percentage on the powerplay, so we’re talking about a 35% increase.

Considering the elite talent on the Oilers powerplay and the chemistry they’ve established over the years, it’s safe to assume Draisaitl will continue to get plenty of chances and help the club generate offence. But it’s hard to know how well he’ll convert on his chances and maintain a 31% individual shooting percentage. In the last three seasons, only three forwards among 206 powerplay regulars have posted an individual shooting percentage over 30%. Draisaitl has been 14th among this group with a 23.50% shooting percentage, so it’s not out of the realm of possibility.

Either way, the Oilers have an elite powerplay producer. And if his regular linemates can stay healthy and if he can maintain first-line level production at even-strength, Draisaitl should be able to chase 100 points again next season.

Data: Natural Stat Trick

Also posted at The Copper & Blue.

Youngster

Couple thoughts on Ryan McLeod, who is getting some attention for the mistake he made in Toronto on Saturday that led to a goal against.

McLeod has been solid for the Edmonton Oilers this season as a centerman. He’s 23, averaging about 14 minutes per game, in a predominantly third-line role. And he’s got nine goals and nine assists at even-strength (5v5) – a rate of 1.76 points per hour, which is just under what second liners should be posting. He’s also been a regular on the penalty kill, getting the third highest total minutes. With him on the ice when shorthanded, the Oilers see their rate of shots against drop by about 15% relative to the team average.

Back to even-strength. McLeod’s been a big reason why the Oilers are doing well without McDavid on the ice – a major spot of bother for the club since McDavid’s arrival. With McLeod on the ice, the Oilers have posted a Corsi For percentage of 53.35% and an Expected Goal share of 55.09% – both of which are higher than the team average. The table below lists the on-ice numbers for the Oilers forwards (sorted by ice-time) with a basic heat map applied to show how each player has done relative to their teammates this season.

Again, it should be noted that McLeod barely spends any time with McDavid. Below is a table of the Oilers forwards sorted by their proportion of ice time spent with McDavid, along with their on-ice Corsi For percentage and Expected Goals share without McDavid. McLeod has only spent 3.3% of his total ice time with the captain – one of the lowest proportions on the team. And he’s been just fine (unlike some of the other forwards), posting shot-shares above 53% – again some of the best numbers on the team.

And while it’s true that McLeod doesn’t play against the other team’s top players as often as others, when he does get deployed against them he’s done pretty well. This season McLeod has spent about 20.6% of his time against Elite competition, according to PuckIQ. And in that time, he’s posted a Corsi For% of 47.90%, which ranks 6th among the Oilers regular forwards this season. And against Elites, he’s also posted a Dangerous Fenwick share (i.e., a weighted shot metric using shot distance location and type of shot to give each shot a “danger” value) of 53.20%, which ranks second on the team only behind McDavid. There’s a reason why he was even on the ice against Marner on Saturday night.

If there’s still any doubt about McLeod’s abilities or hesitation of deploying him regularly in meaningful moments, look no further than his performance in last season’s playoffs. With him on the ice at even-strength, the Oilers posted some of the best shot-shares – including a 53.60% Corsi For percentage (third highest on the team) and a 54.57% Expected Goals share (fifth highest). When the Oilers got crushed by the Avalanche in the western conference finals, McLeod was one of two players who had a positive shot-differential and broke even in terms of goals. My personal favorite stats for McLeod were from the second round series against Calgary. In that series, McLeod played about 14 minutes head-to-head against the Tkachuk line and went 20-10 in shot attempts, 9-7 in shots and 1-0 in goals. That’s the kind of productivity a team needs from their depth players to win games.

McLeod has been solid for the Oilers this season and has provided exceptional value based on the contract he’s currently on. His on-ice performance numbers and productivity is all you can ask for from a young centerman playing third-line minutes and the penalty kill. And there’s no doubt he’ll continue to grow if he’s in the right environment for development. He’ll make mistakes like any other player, but his importance to the team and the long-term goals cannot be overlooked.

Regular season, even-strength, penalty kill, playoffs. This is the kind of depth player that’s going to increase your chances of winning games.

Data: Natural Stat Trick

Also posted at The Copper & Blue.

Eyes on the prize

The Oilers are currently sitting fourth in the Pacific division, having secured 80 points in 66 games – a points percentage of 0.606 that ranks in sixth in the western conference. They’re currently the highest scoring team in the league, average 3.82 goals per game – driven largely by their powerplay scoring which ranks first in the league and their even-strength (5v5) scoring rate which ranks sixth. And it was their inability to prevent shots, scoring chances and goals early on in the season (about the first 19 games as we’ll get to in a minute) that’s prevented them from being higher up in the standings. Over the full season, they’ve allowed the 12th highest rate of goals against, ranking 22nd at even-strength and 27th on the powerplay.

Now when we look at the team’s progression over the season, we see that the Oilers have greatly improved at even-strength – and actually turned things around much earlier in the season than I think most people realize. Their performance metrics, which includes shots and scoring chances, all steadily increased after an embarrassing loss on November 21st in New Jersey. The Devils dominated the Oilers that night, posting a 60% share of the shots and scoring chances and scored four even-strength goals. After this loss, the Oilers sat 18th in the league in terms of points percentage, having allowed the sixth highest rate of shots against at even-strength in the league, the third highest rate of scoring chances and the seventh highest rate of goals against. It was looking dire.

But since that loss on November 21st, the Oilers have arguably been one of the best even-strength teams in the league, with the results to prove it. Their goal differential of +17 in this time range ranks second in the western conference, and it’s been supported by strong shot-share numbers – indicating that the results have been real and sustainable. Their 54% Corsi For percentage, a proxy for puck possession, is second in their conference and third in the league. And their expected goal-share, which factors in shot quality and serves as a proxy for scoring chances, is second highest in the league only behind Carolina. Below is a summary of their results since late November (the last 47 games), including their ranking in the league and the western conference.

What’s played a major role in the Oilers turnaround this season is the team’s depth players who have managed to outshoot and outscore opponents without their top stars on the ice. Up until that loss in New Jersey earlier in the season, it was looking like the Oilers were going to have the same issue as almost every other year – where the team would generate goals with McDavid on the ice, but give everything back when he wasn’t on the ice. The team was posting Corsi For and Expected Goals For percentages below 45% without McDavid on the ice, and posted a -9 goal differential early on in the season. McDavid himself wasn’t breaking even, which sank the Oilers team goal-share to one of the worst levels in the league. But since that loss in New Jersey, it’s been a different story with the Oilers posting shot-share numbers above 53% and a goal differential of +15 without McDavid on the ice. That’s a massive lift for the team and should be an area of strength heading into the playoffs when depth scoring becomes critical for success.

The one concern for the Oilers remains goaltending, which has ranked 23rd in the league in this time period. And we know it’s been Jack Campbell who has struggled the most. Among 57 goalies who have played at least 500 minutes, Stuart Skinner ranks 16th with a 0.921 save percentage and a +3.87 GSAA. Campbell on the other hand ranks 51st in this group with an 0.895 save percentage and 49th with a -8.85 goals saved above average (GSAA).

Put another way – had Campbell provided league average goaltending in the 22 games he played since November 21st, the team would have allowed eight fewer goals. That would have had them at a 56% goal-share, and likely higher up in the standings with an additional win or two. Again, this was in a time period of the season where the skaters (with and without McDavid) did a masterful job controlling the flow of play, allowing the ninth lowest rate of shots against in the league, and the fourth lowest rate of expected goals against. If the Oilers can even get league average goaltending the rest of the way, they should remain competitive in the western conference.

Heading into this final stretch of the season, it’s fair to expect the Oilers to finish strongly, especially when you consider how well the team has performed at even-strength since November, the addition of Mattias Ekholm to the defence core, the general health of the roster and the career season some of the top forwards are having. Combine that with strong performance and results from the depth players and good goaltending from Skinner, I think it’s fair to label the Oilers as a legitimate contender heading towards the playoffs.

Data: Natural Stat Trick

Also posted at The Copper & Blue.

Across the NHL, powerplays are powering up

Goal scoring is up this season. And powerplays appear to be a major factor. A look into the key drivers, the growing importance of powerplays, and how this could impact the Edmonton Oilers.

When I was digging into the Oilers special teams numbers recently, I found that there’s been a real increase in the rate of powerplay scoring across the league. Goal-scoring overall (all-situations) has been increasing over the last few seasons thanks to an influx of talent in the league, with more and more players becoming point-a-game producers. And powerplays appear to be one of the driving factors.

First we have to keep in mind that powerplay opportunities this season are up slightly. In the last six regular seasons (2017/18 to 2021/22), teams on average received about 2.84 powerplay opportunities per game. This season, it’s up to 3.15. (Source: Hockey Reference).

So far in the 2022/23 season, teams on average are scoring at a rate of 7.84 goals per hour on the powerplay, which would translate to about 55 goals over a full 82-game season. This rate of goal-scoring is an increase of 10.2% compared to the goal-scoring over the previous six seasons (7.12) when teams would score around 49 powerplay goals on average (over an 82-game season). The upward trend appears to have started in 2021/22 – the first real 82-game season following two pandemic-shortened seasons that had limited games, limited fans and limited gate revenue.

What’s interesting is that it’s not necessarily just the finishing ability that’s driven the powerplay success. Shooters as a collective are getting better, currently converting 13.9% of their powerplay shots into goals this season, an increase from the 13.4% players had posted on average over the previous six seasons (an increase of 4.2%).

But the bigger factor in the growth of powerplay scoring has been the increased rate of unblocked shot attempts (i.e., Fenwick, a proxy for scoring chances) and shots on goal – things that are driven not only by the talent on the ice but the tactics implemented by the coaching staff.

This season, teams are averaging 78.66 unblocked shot attempts per hour on the powerplay, an increase of 7.0% compared to the previous six seasons. And the rate of actual shots on goal is up by 5.9%, sitting at 56.26 per hour so far this season (refer to Appendix A for a summary table). Again, the upward trend in generating chances and shots appears to have started last season – and I think we can expect it to continue to climb because of the talent in the league, and with teams recognizing the importance of powerplay scoring.

This season, 1,179 powerplay goals have been scored in the league, which is 21.8% of the total goals scored (i.e., all-situations). This is a 7.8% increase over the previous six seasons when powerplay goals made up 20.3% of the total goals. So that’s about 85 more powerplay goals than expected. Should note, the proportion of even-strength (5v5) goals is actually down compared to previous seasons – sitting around 64.9% of total goals this season compared to 66.9% over the last six seasons (refer to Appendix B for a summary table).

From an Oilers perspective, I think the key takeaway here is that the competitive edge that their powerplay currently provides is eventually going to be reduced as more and more teams get better on their powerplays. I think teams, and especially owners, want to be more competitive not only to win games, but to also re-coup their financial losses caused by the pandemic and other factors. And to do that, it’d probably be in their best interest to use the growing talent pool to push for more goals – especially on the powerplay – and more wins in the standings.

In response to the increased offence generated by powerplays, which will likely continue increasing, it may be in the Oilers best interest to find new solutions for the penalty kill. As I wrote about recently, the Oilers penalty kill started off very poorly this season but has improved as they’ve adjusted their deployment, reduced the rate of shots and chances against and received better goaltending. But it might be time to bring in more expertise at the coaching level and player level to ensure that the penalty kill doesn’t cost the team any more wins, like it did earlier this season.

Put another way, the Oilers penalty kill has to become one of their competitive edges if they want to have success.

Data: Natural Stat Trick, Hockey Reference

Also posted at The Copper & Blue.

Appendix A: League-wide powerplay averages by season

Appendix B: Goals scored by season, across different game-states

Pacific depth

With the Oilers currently ranking fifth in the Pacific division and trying to gain some ground in the standings, I wanted to get a sense of the competition in the Pacific and how each team’s depth is performing at even-strength (5v5). None of the teams in the Pacific have been overly intimidating, with each having their own issues either at even-strength or on special teams, and enduring inconsistent play throughout the season. So the race is really going to come down to what edge a club could have over their competition and how aggressively their management moves to address their own deficiencies.

To get a snapshot of each Pacific division team’s depth, I took the forward from each roster who has played the most even-strength (5v5) minutes this season and used their on-ice numbers as a proxy for their team’s first line. I then looked at how each team has performed without that player at 5v5 to evaluate the team’s depth. On average, top lines are deployed for about 30% of a team’s total 5v5 time, leaving a lot of minutes for the depth players who can really make or break a team’s season. It’s also a great way to evaluate how well a general manager has constructed their roster.

Below are the forwards for each team who will serve as a proxy for their team’s first line. Included for reference is their proportion of their team’s total even-strength (5v5) time.

Team Top Line Player TOI%
Anaheim Trevor Zegras 32.6%
Calgary Nazem Kadri 28.2%
Edmonton Connor McDavid 33.6%
Los Angeles Anze Kopitar 30.1%
San Jose Timo Meier 31.9%
Seattle Alex Wennberg 29.0%
Vancouver J.T. Miller 28.9%
Vegas Mark Stone 29.7%

The first table below shows how each team’s top line has performed at even-strength this season, sorted by the team’s current ranking in the Pacific division (based on points percentage). I’ve included the team’s actual results (i.e., goal-share and goal-differential) along with the shot-share metrics like Corsi For percentage (CF%, a proxy for puck possession), and Expected Goals For percentage (xGF%, a proxy for scoring chances) to get a sense of which teams have the right processes in place and if the results are sustainable or not. I’ve also included the team’s shooting percentage and save percentage. A basic heat-map has also been applied to show which teams are doing well or struggling relative to their division rivals.

This second table shows how each team has performed at even-strength without their top line, and included the same data points as the previous table. Again keep in mind, this is for about 70% of the team’s total 5v5 ice time, and will have a major impact on the team’s final standings.

Edmonton isn’t looking too hot here, considering the expectations heading into this season. The top line results at 5v5 have been mediocre, struggling to outscore opponents (+3 goal-differential) and just barely controlling the flow of play. Edmonton’s number’s without their top line are similar to how it’s been the last number of years, with the club consistently getting outshot and outscored – and giving back the majority of the goals that the top line has generated. Their 45.36% goal share without their top line is only ahead of San Jose and Anaheim in the Pacific, and barely ahead of Vegas. It’s a clear indication that management has again done a poor job constructing a competitive roster around their superstar player.

At the top of the division, it appears Vegas is a top-heavy team – controlling the flow of play and outchancing and outscoring opponents with their top line, but giving back everything that’s been gained when their other lines are out there. Vegas’ 44.86% goal-share without their top line is currently only better than San Jose and Anaheim’s, and is the reason why Vegas’ overall 5v5 goal differential is only +1. Seattle is the opposite from Vegas as their top line is the one getting outscored – the third worst goal-share in the Pacific – but getting bailed out by their other three lines that have posted a +26 goal differential. Both Vegas and Seattle are doing a decent job creating opportunities with and without their top lines, a good sign that things should gradually improve. It’ll come down to their finishing talent with either individual players bouncing back or if their management starts exploring the trade market.

Los Angeles and Calgary are pretty similar to one another, doing well when it comes to shot-share metrics regardless of which lines are out there, but are getting sunk by their goaltending that currently ranks near the bottom of the league. They’re both hanging in there though, posting positive goal-differentials with and without their top lines and should continue to remain competitive down the stretch. Calgary’s depth especially should be seeing better results considering their 56% Corsi For percentage and Expected Goals For percentage, but it’ll come down to their finishing talent up front and goaltending. Of the other three clubs at the bottom of the Pacific division standing, San Jose is the most noteworthy as their top line is doing well, posting some of the best shot-share metrics in the division and a 52% goal-share. But they’re clearly lacking everywhere else as their other lines spend more time without the puck and getting outscored at a high rate.

It remains to be seen how Edmonton will make ground in the standings, but it doesn’t appear they’ll see much progress at even-strength, especially when other clubs are posting better shot-share numbers with and without their top lines. It’s again going to come down to what McDavid can do and hope that the rest of the roster can somehow break even in terms of shots and goals when he’s not on the ice. And it’ll be up to the coaching staff to first identify the issues and make the necessary tactical and line-up adjustments. The powerplay is likely going to be the reason Edmonton remains in the race, but it could be over quick if they continue to struggle at even-strength and if the penalty kill continues to be poor.

Data: Natural Stat Trick

Also posted at The Copper & Blue.

What’s going on with Leon? – Part 2

The last time we checked in on Leon Draisaitl a few weeks ago, he was getting lots of points on the powerplay but really struggling to produce at even-strength. His rate of points per hour was well below his career levels, and he was posting some of the worst on-ice numbers on the team with the Oilers getting badly outshot when he would be on the ice.

Likely recognizing Draisaitl’s issues at even-strength and the negative impact it was having on the team’s overall results, the coaching staff made some adjustments to get the forward’s even-strength production back on track. The solution: give Draisaitl more ice time with Connor McDavid.

Over the last ten games, the coaching staff has deployed the two on a line together at even-strength more consistently and it’s done wonders for Draisaitl. In these ten games since November 26th, Draisaitl has posted nine points in 166 minutes of ice time – a points per hour rate of 3.25. That’s a significant improvement from the first 20 games of the season when he had nine points in 306 minutes – a points rate of 1.76 and well below his previous three year average of 2.68.

The table below breaks down Draisaitl’s individual and on-ice numbers in the first twenty games of the season where he spent about 20% of his ice time with McDavid, and the last 10 games where he’s been McDavid’s regular wing man, spending 98% of his ice time with the captain.

A big reason why Draisaitl has been so much more productive is the significant improvement in his on-ice shot-share numbers. Playing alongside McDavid, Draisaitl has seen his on-ice possession numbers (i.e., Corsi) and share of scoring chances (i.e., Fenwick) improve by about ten percentage points, going from around 43% all the way to 53% – levels you would expect from high-end talent. The team is spending far more time playing with the puck when Draisaitl has been on the ice in the last ten games, and the results have been much better as well. Prior to being McDavid’s regular winger, Draisaitl was posting an on-ice goal-share of 45% (a -3 goal differential). Since then, he’s posted a goal-share of 57%, a +3 goal differential in these ten games.

With Draisaitl needing to play with McDavid more often to remain productive, it does make the Oilers more vulnerable to getting outshot and outscored when the two aren’t on the ice. Instead of playing around 18 even-strength minutes per game without one of the two being deployed, the Oilers are now playing about 29 minutes per game without them. The Oilers play about 47 minutes per game at even-strength this season, meaning they won’t have one of their two star players on the ice for about 61.7% of their 5v5 time. Ideally, coaches are spreading out their offence and Draisaitl is a scoring threat on his own line, giving the coaching staff an advantage when it comes to even-strength matchups and overwhelming opponents. But if Draisaitl can’t put up even-strength points and becomes a defensive liability without McDavid, the Oilers coaching staff will need to figure out deployment and tactical strategies for the other three lines to ensure they’re not getting out-shot, out-chanced and out-scored without the two star forwards. This might also require some tweaks to the roster construction, something Oilers management has often struggled with.

Up until this point of the season (30 games in), the Oilers are posting a 49% Corsi for percentage and a 47% Expected goals for percentage when McDavid and Draisaitl haven’t been on the ice. These below-average shot-share numbers have lead to a 47% goal-share, or a -2 goal differential – a major issue for the team that has high playoff aspirations. And while the results without McDavid or Draisaitl on the ice have been better over the last ten games, it doesn’t appear to be sustainable considering they continue to get out-chanced regularly without their star players.

So while it’s great to see Draisaitl produce at even-strength again, it does come at a significant cost – one that could impact the Oilers chances of being a legitimate contender.

Data: Natural Stat Trick

Also posted at The Copper & Blue.

Dispirit

With the Edmonton Oilers currently struggling to break even at even-strength (5v5) this season, they desperately need their special teams to keep them afloat and competitive in a fairly mediocre Pacific division. And while the Oilers powerplay continues to dominate and remain one of the best in the league, the penalty kill is struggling mightily allowing one of the highest rates of goals against in the league, completely nullifying everything that their high-octane powerplay has produced.

Over the first 25 games of the season, the Oilers penalty kill has allowed 26 cumulative goals against (3 GF, 29 GA) – a rate of 12.60 goals against per hour, which is fourth highest in the league. One of the main drivers for their poor results is the team’s defensive play, as the club struggles defending the blue line for zone entries and keeping chances outside the high danger scoring areas. And this is reflected in the team’s rate of unblocked shot attempts against (a proxy for scoring chances), which is ninth highest in the league (82.98 per hour) and the rate of shots on goal against which is sixth highest (61.69 per hour).

The team’s defensive play is an issue that’s carried over from last season when they were posting similar numbers, but were being bailed out by the goaltending which posted the 10th best save percentage in the league (87.53%). This year, they’re not getting the same rate of saves on the penalty kill as the current Campbell-Skinner tandem has thus far posted a combined save percentage of 79.58% – which ranks 29th in the league. Campbell is especially struggling on a high-event penalty kill, something that was somewhat expected considering his previous team in Toronto allowed some of the lowest rate of shots against when shorthanded. Among 42 goalies who have played at least 45 minutes on the penalty kill this season, Campbell ranks 39th with a 78.90% save percentage and a -4.73 goals saved above average. Skinner isn’t faring much better, as he ranks 36th in the same pool of goalies with a 80.30% save percentage and 37th when it comes to goals saved above average with -3.21.

These results are especially frustrating when you consider the fact that everything the Oilers powerplay has done for the team has been completely offset by the defensive play and goaltending on the penalty kill. Consider the talent on the powerplay, the cost of these players, the practice time, and the chemistry that’s been developed for them to be one of the best units in the league. It’s all been washed away by a penalty kill that surrenders so many shots, chances and goals against – and preventing the powerplay from being an actual asset. Especially at a time when the Oilers are struggling at even-strength, posting a negative goal differential and below-average shot-share numbers, the Oilers can’t afford deficiencies of this scale.

The Pacific division is wide-open at this point with six of the eight teams currently posting negative goal differentials (in all situations). Fixing the penalty kill, either through tactical or deployment adjustments, has to be a top priority for the coaching staff if they intend on locking down one of the top three playoff spots.

Data: Natural Stat Trick

Also posted at The Copper & Blue.

What’s going on with Leon?

The star forward is among the league leaders in points, but his production and on-ice numbers at even-strength are lower that expected. It’s critical for the coaching staff and management to figure out what’s going on with Draisaitl if they want their 5v5 numbers to improve.

There’s obviously a lot of team-wide issues right now for the Edmonton Oilers, as the club ranks fifth in the Pacific with a 0.526 points percentage and ninth in the western conference. Defensive play has been poor, the offence has dried up, and there’s plenty of questions about the roster construction and the potential internal solutions. It’ll be interesting to see how the coaching staff and management navigate things in such a high pressure season.

Even-strength (5v5) play is the biggest point of weakness for the club as they’re getting out-shot, out-chanced and out-scored regularly – ranking in the bottom third of the league when it comes to performance indicators that drive positive results. And it’ll need to improve if the Oilers want to keep up with the top teams in the league.

One player in particular that is currently struggling playing even-strength minutes is Leon Draisaitl. He’s a proven star in the league and can improve the team’s odds of winning games. And he’s among the league leader in points this season because of his dominance on the powerplay. But his even-strength numbers this season, including his personal numbers and his on-ice numbers, have been poor compared to his previous three seasons – and it’s part of the reason why the Oilers are struggling to win games.

Starting with his personal numbers, Draisaitl currently has nine even-strength points which ranks fourth on the Oilers – a points per hour rate of 1.85. That’s a drop from the 2.68 points per hour from his previous three seasons – a level that top line, star forwards typically produce at. Heading into this current season, Draisaitl’s rate of points ranked 17th among over 500 forwards who played at least 1,000 minutes since 2019, a period in which he’s accumulated the third highest number of points in the league. His current rate of 1.85 ranks 131st among 324 players who have played at least 200 minutes this year – not anywhere near where he should be considering his history.

What’s driving his drop in production is his individual rate of shots per hour which has decreased from 6.43 per hour over the last three seasons to 5.56. And his shooting percentage is also lower than expected, currently sitting at 14.81%. Considering his age and his talent, you would expect to see his rate of shots and his shooting percentage to gradually improve, resulting in better productivity over the course of the season. But there’s a couple other issues to consider.

One reason for his lower rate of shots per hour this season is the fact that the Oilers are spending a significant amount of time without the puck when he’s on the ice, as reflected by the team’s Corsi For percentage (a proxy for puck possession) of 42.83%. The team is also getting out-chanced more regularly when Draisaitl is on the ice with, as reflected by their 43.19% share of expected goals (a proxy for scoring chances and shot quality) – which again is a drop from the levels we’ve seen with him on the ice over the last three seasons. All of Draisaitl’s on-ice shot-share numbers (i.e., Corsi For%, Fenwick For%, Expected Goals For%) are some of the lowest on the team, only ahead of Holloway and Shore. And it’s on the defensive side of things where the Oilers are really struggling with Draisaitl, as they see more than a 17% increase in the rate of shot attempts, unblocked shot attempts and shots on goal against with their star forward on the ice. The rate of expected goals against this season – which factors in shot quality and scoring chances against – increases by 26% with Draisaitl on the ice, going from 2.78 per hour to 3.51.

Draisaitl’s poor on ice numbers at even-strength is pretty significant considering the expectations on him as a player and the team this season. The Oilers top six is supposed to be one of the best in the league, but it’s hard to accomplish anything when a star forward is struggling and the team is failing to control the flow of play and total scoring chances with him on the ice.

What’s worth noting is that Draisaitl is struggling with pretty much every linemate and defenceman on the Oilers, unable to post shot-share numbers like Corsi For% and Expected Goals For% above the 50% break-even mark, regardless of the player he’s with.

The one player that Draisaitl is having success with this season is Bouchard, as they’ve played 90 minutes together and posted a Corsi For percentage of 51.71% and an Expected Goals For percentage of 52.26 – both numbers being well above the team’s current averages. With Nurse having his own issues and posting some of his worst on-ice numbers in his career this season, it might be beneficial to the team, and especially for Draisaitl, if Bouchard saw an increase in his even-strength minutes and more time with the top lines.

Whatever the coaching staff and management decide to do to improve the team, whether it’s internal or external solutions, it’s important to have a firm grasp of the real issues plaguing the team and implementing changes that help improve the odds of winning games. Considering their poor results and underlying numbers at even-strength – where 80% of the game is played – it’s critical they focus here first and find tactical and deployment solutions as soon as possible.

Data and glossary: Natural Stat Trick

Also posted at The Copper & Blue.

Issue detection

Really can’t emphasize enough how much of a drop off there’s been when comparing this season’s results to last season after the coaching change occurred. One of the biggest improvements the Edmonton Oilers made after Jay Woodcroft took over in February 2022 – and what helped drive the overall results – was the team’s possession and scoring chance numbers at even-strength as the club went from around league-average levels to being one of the best in the league.

After the coaching change last season, the Oilers played more aggressively with leads, they spread out their offence across multiple lines and their depth players weren’t getting out-shot and out-chanced as much as they had been in previous seasons. All of these coaching-driven factors played a major role in the overall results at the end of the 2021/22 regular season, and the process behind it all was based on sound logic and reasoning.

Fast forward to this season, and the team isn’t anywhere near where they were in the final thirty-eight games of last season. Their possession numbers and share of scoring chances are currently some of the lowest in the league, with their Corsi For percentage dropping down from 53.71% last season to 47.76% this season. And their share of expected goals is down to 46.29% – which ranks 26th in the league only ahead of Anaheim in the Pacific division.

Now it’s understandable if the Oilers defensive play gets most of the attention as the results are what stands out first. They’re currently allowing the seventh highest rate of goals against at even-strength (2.78), and their penalty kill is allowing 12.04 goals against per hour – the third highest in the league. Management didn’t exactly build a strong, championship caliber defence core either and we’ve seen established players struggle throughout this season and some of the young prospects struggle to gain traction at the NHL level. The team also spent a lot of money on a new starting goalie who is struggling early on this season – which was also somewhat expected.

When we dig into the actual results, we see that they’re somewhat expected as the club is having all sorts of issues preventing shots and scoring chances at even-strength, with their rates all having increased by a significant margin compared to last season. For instance, the rate of expected goals against – which factors in shot quality and the probability of an unblocked shot becoming a goal – has increased by 17.4% this season. The table below shows the other defensive numbers from this season and the thirty eight games under Woodcroft from last season with percentage changes.

What’s further troubling are the issues up front.

With arguably one of the best top-six forward groups in the league, and with the powerplay having a lot of success and McDavid and Draisaitl leading the league in points – it can generally be assumed that the Oilers offence is and will be just fine. But if we take a look at the numbers at even-strength, that’s really not the case. And things have taken a significant hit compared to last season, similar to the levels experienced on the defensive side of things.

The Oilers are only scoring 2.26 goals per hour at even-strength, which ranks 24th in the league and last in the Pacific division. The biggest issue is that they generate some of the lowest rates of shot attempts, shots on goal and scoring chances – all of which have dropped over 10% compared to last season. The Oilers current offensive rates have them in the bottom third in the league for each category – a big drop off from the end of last season where they were closer to the top five in the league after Woodcroft took over.

You’d hope someone in the Oilers management group is aware of this situation and is questioning (a) how the roster was built the way it was, and (b) the coaching tactics and player deployment that is being implemented. There’s a significant problem in Edmonton both offensively and defensively, and it’s critical for the team to get things on track if they want to be considered a championship contender.

Data: Natural Stat Trick

Also posted at The Copper & Blue.

Drop off

Pretty rough start for the Edmonton Oilers, securing only four points in their first five games of the season – all of which were at home and included three losses in regulation time.

The issue for the Oilers – which has been an ongoing thing for years now – is their play at even-strength (5v5) where they have only scored five goals in five games. We can’t expect this to last forever considering the talent they have and the fact that the team is currently converting only 4.38% of their shots into goals – the lowest shooting percentage in the league. This is a team that’s typically around the league average rate of about 8.50% and a number of players – including McDavid and Draisaitl – are posting on-ice shooting percentages well below their career levels.

What is concerning, however, is that the team itself is generating a relatively low rate of shots and scoring chances at even-strength this season – numbers much lower than they were last year after Jay Woodcroft took over as head coach. Shot metrics, including the rate of shots for and against and the overall share of total shots, are driven by tactics and deployment – things that are under the control of the coaching staff. So it’s been a little surprising to see the drop off.

The table below shows the Oilers offence as reflected by the team rate of shot attempts (Corsi), unblocked shot attempts (Fenwick), shots and expected goals (xGoals) this season compared to the numbers last season after Woodcroft took over. The numbers have been score and venue adjusted based on Natural Stat Trick’s methodology.

Now I’m using the numbers from last season under Woodcroft as a comparison because that was a really good team we saw in the final 38 games of the season. And they had the results and the strong underlying shot share numbers that top-end teams post at even-strength – levels that the Oilers should be trying to reach to be considered legitimate contenders.

And so far, they’re below where they should be. For example, the Oilers are currently generating about 37 unblocked shot attempts per hour, which ranks 25th in the league, only ahead of teams like Montreal, San Jose, Philadelphia, St. Louis, Anaheim, Chicago and Arizona. This current rate is about 20% lower than where they were last season when they generated over 46 unblocked shot attempts per hour – which was top five in the league. Their actual shots on goal has dropped by 18.6% compared to last season and their rate of expected goals has dropped by 13.3%.

Yes it’s five games, and there’s plenty of time to correct this. But it’s a good topic to ask the coaching staff about considering some of the other higher-end teams are getting positive results due in large part to their ability to out-shoot and out-chance opponents consistently. Pittsburgh for example is off to 4-0-1 start, have scored 19 even-strength goals, are generating some of the highest rates of shots in the league and are posting shot-share numbers (like Corsi For% and Expected Goals For%) above 52%.

That brings me to my next point. Because of their lack of offence and issues controlling the flow of play and generating shots, the Oilers are also posting poor possession and shot-share metrics compared to last season under Woodcroft.

The Oilers currently rank in the bottom third of the league when it comes to things like Corsi For% (46.61%, 23rd overall), Fenwick For% (44.15%, 27th overall) and Expected Goals For% (45.45%, 21st overall), well below where they were last season when they ranked near the top of the league after Woodcroft took over.

And if we look at the top teams from last season, and how they did in their first five to six games, we see that while the results may not have been there right off the bat, at least they were beating opponents on the shot clock and setting themselves up for success. Six of the top seven teams in terms of points percentage last season posted a Corsi For% above 50% in their first few weeks of the season and averaged an expected goals share above 53%. Interesting to see that Colorado was the one team in this group that struggled early on, but managed to turn it around – definitely an outlier that the Oilers can try to emulate.

It’ll be interesting to see how the Oilers can turn things around at even-strength, and the influence Woodcroft can have on the underlying numbers through potential tactical and deployment adjustments. Woodcroft and his coaching staff did set the bar quite high based on the numbers the Oilers posted last season. But it’s important to reach those expectations as soon as possible if the Oilers want to improve their chances of winning hockey games and establishing themselves as contenders.

Data: Natural Stat Trick

Also posted at The Copper & Blue.