
Disappointing end to an entertaining playoff run, with some outstanding performances from a variety of players including McDavid and Draisaitl leading the way. In the end, the Oilers were completely dominated by a top end team, and really didn’t have the depth, talent and goaltending to win a game in the western conference finals.
Below is a high-level summary on how the Oilers performed against the Avalanche at even-strength (5v5). They spent a significant amount of time without the puck and getting out-chanced as reflected by their 46% Corsi For percentage and 45% expected goals for percentage – and were outscored 16-11 over the four game set.
| Colorado Avalanche | 5v5 | Edmonton Oilers |
| 53.28 | Corsi For% | 46.72 |
| 55.68 | Fenwick For% | 44.32 |
| 55.03 | Expected Goals For% | 44.97 |
| 59.26 | Goals For% | 40.74 |
| +5 | GF-GA | -5 |
| 11.76 | Shooting% | 10.95 |
| 89.05 | Save% | 88.24 |
And the powerplay – which has consistently been one of the best in the league – was ineffective as well, generating only 18 shots and scoring only twice in four games. Combine this with a penalty kill that allowed 30 shots against and allowed four goals (more on that later), and it’s clear that the Oilers weren’t even close in this series.
There’s a few reasons why it wasn’t surprising to see the Oilers get crushed like this against Colorado. The injury issues for one exposed the lack of depth and talent on the roster. But the overall team play had also begun to slip in the previous round against Calgary, relying on an incredible performance from McDavid to bail them out. The goaltending started to falter in the second round as well, as did their defensive play and special teams.
Lets’s start with the overall team play at even-strength and how well they controlled the share of shot attempts, scoring chances and goals. Below is a table showing how the Oilers performed in each round of the playoffs – as well as the final twenty five games of the regular season, which I like to use as a baseline to assess their overall play.
| Opponent (5v5) | Corsi For% | Fenwick For% | Expected Goals For% | Goals For% | Shooting% | Save% |
| Regular Season | 53.38 | 53.25 | 52.74 | 55.17 | 9.01 | 91.59 |
| vs Los Angeles | 53.95 | 53.46 | 57.83 | 57.27 | 7.95 | 93.42 |
| vs Calgary | 42.75 | 44.56 | 47.07 | 56.60 | 15.72 | 89.68 |
| vs Colorado | 46.72 | 44.32 | 44.97 | 40.28 | 10.95 | 88.24 |
Against the Kings, the Oilers performed right around where they were in their final twenty five games of the season, controlling 53% of the total shot attempts and scoring chances. The team’s shooting percentage dropped by a couple percentage points, but it was balanced out by the goaltending that saw its team save percentage increase by a couple percentage points. Keep in mind though that the Kings consistently generated a lot of low-probability shots and had the worst shooting percentage in the league during the regular season. And there was definitely some concern after the first four games of that series as the Oilers were getting outplayed and outscored when McDavid wasn’t on the ice and their goaltending was struggling on home ice. But thanks to the captain’s play in games six and seven, they were able to overcome their deficiencies and win the series.
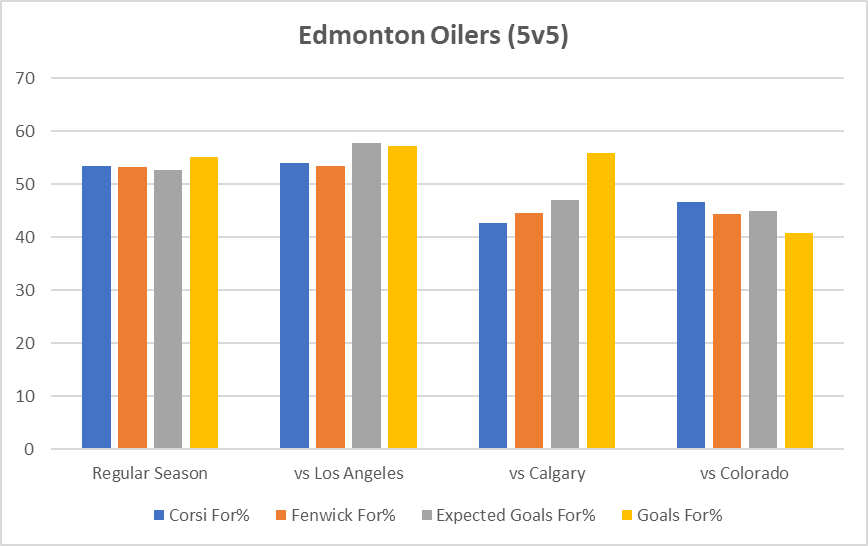
The second round of the playoffs is really where we started to see the Oilers fall apart at even-strength. Their possession numbers dropped by more than ten percentage points relative to their final twenty five games of the season – dropping from a 53.38% Corsi For percentage to 42.75%. And while their share of quality scoring chances (i.e., Expected Goals For%) did gradually improve over the course of the series, it was still below where we would expect the Oilers to be at. What bailed them out (again) was McDavid’s play, as the Oilers completey dominated the Flames on the scoreboard with him on the ice. When Tkachuk and some of his teammates said their club was beaten by one guy, they weren’t wrong. The Oilers outscored the Flames 14-5 with McDavid on the ice in that series, scoring at a rate of over nine goals per hour. It’s remarkable considering nine goals an hour is what a top end powerplay scores – with a man-advantage.
Now this is worth expanding on because McDavid’s performance was once again masking a lot of the Oilers major issues.
McDavid’s on-ice shooting percentage in the five-game series against Calgary was 25.79%, which is crazy considering his career on-ice shooting percentage is 10.1%. Had his on-ice shooting percentage against Calgary been similar to his career levels, he would have been on the ice for about 5-6 goals instead of 14 – and the Flames would have easily won the goal-share. And say his on-ice shooting percentage was 20% – which has happened only once over a five game stretch in the last three seasons (first five games of the 2019/20 season) – he would have been on the ice for about 10 goals-for. Had that occurred, which still would have been remarkable, the Oilers would have only broken even in terms of goals at 5v5 against the Flames.
| McDavid (5v5) | On-ice Shooting% | On-ice Save% |
| Regular Season | 9.66 | 91.46 |
| vs Los Angeles | 10.96 | 93.35 |
| vs Calgary | 25.79 | 92.07 |
| vs Colorado | 11.75 | 87.97 |
Things obviously came back down to earth (or the planet he’s from) for McDavid in the third round. His on-ice shooting percentage fell to11.75%, which is slightly higher than his career level (10.1%) and what he had posted in the final twenty five games of the regular season (9.66%).
The other indication that things were likely going to go sideways against Colroado was the Oilers declining defensive play in the previous rounds and the increasing rate of shots against.
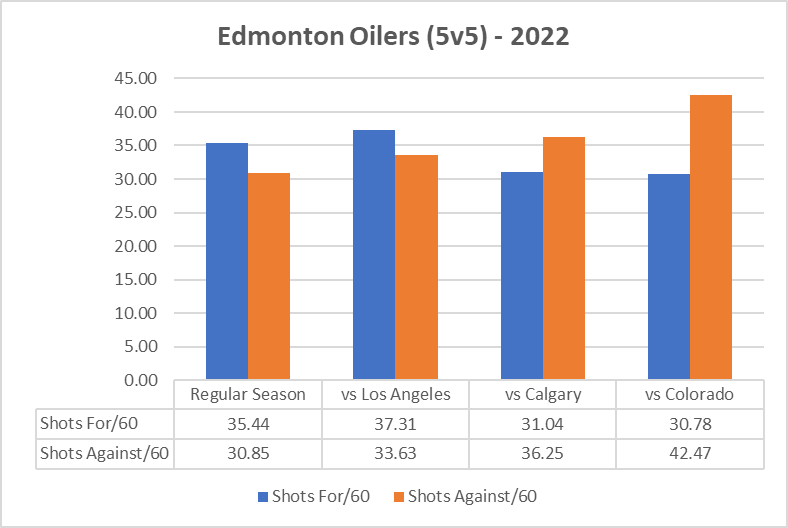
In the final twenty-five games of the season, the Oilers allowed 30.85 shots against per hour, which ranked 17th in the league and right around league average levels. And they generated 35.44 – third best in the league. Against the Kings, their rate of shots against increased to 33.63, a 9.0% increase from where they were in the regular season. Somewhat expected, considering the Kings employ the “volume shooting” approach, but nothing too alarming as the Oilers did also increase their own rate of shots for. But maybe it was a sign of things to come as they then allowed over 36 shots per hour against the Flames – a 17.5 % increase from their final twenty five games and closer to what the worst teams in the league posted in the regular season. Based on these increases and the fact that the Avalanche were the fourth best team in the regular season at generating shots (34.58), it was little surprise then that the Oilers allowed over 40 shots against per hour in the third round.

Compounding matters was the Oilers goaltending, which posted a 89.68% 5v5 save percentage in the second round against the Flames – the second worst save percentage among the eight teams in the second round. And only better than Calgary’s that had to face a supernova version of Connor McDavid. Smith’s performance gradually declined over the course of the playoffs, and the team wasn’t playing well enough to make up for it.
One last item was the Oilers special teams, which had great results in the regular season and the first round of the playoffs. But it started to decline against the Flames before getting crushed by the Avalanche.
| Opponent | Powerplay Shots/60 | Powerplay Goals/60 |
Penalty Kill Shots Against/60 |
Penalty Kill Goals Against/60 |
| Regular Season | 70.38 | 10.37 | 62.21 | 4.03 |
| vs Los Angeles | 66.28 | 14.50 | 72.38 | 4.10 |
| vs Calgary | 56.53 | 7.07 | 64.00 | 6.00 |
| vs Colorado | 53.60 | 5.96 | 74.38 | 9.92 |
In the final stretch of the regular season, the Oilers continued to excel on the powerplay, generating the highest rate of shots per hour (70.38) and scoring the sixth highest rate of goals in the league. And while they did see a slight drop in their rate of shots against versus the Kings (maybe this was foreshadowing for the next two rounds) – they did generate a higher rate of goals relative to their regular season. Against the Flames, things took a major dive as their rate of shots on the powerplay dropped by 19.7% relative to their regular season rate. And their rate of goals per hour dropped to 7.07 per hour – which is slightly above league average levels, but well below what we would expect from an Oilers powerplay which is consistently one of the best in the league. The Avalanche took it one step further and reduced the Oilers shot rate by 23.8% relative to their regular season levels and only allowed two goals in the four game series. The Oilers powerplay, which has historically often made up for the negative goal differential at even-strength, slipped in the second round and basically became a non-factor against Colorado.
The Oilers penalty kill followed a similar trend. By the time it faced Colorado, it had seen its rate of shots against (which was slightly worse than league average to begin with) climb even further. And the rate of goals against in the third round more than doubled compared to the regular season. It was ugly.
The Oilers have a lot of work to do this off-season, constructing a roster, managaing their salary cap and filling out a coaching staff. The hope, as always, is that they’re using as much information available to them – including the data from the regular season and the playoffs – to make informed decisions. The plan should be to build a winner in the next three seasons with Draisaitl and McDavid in the fold – and the only way to do that is a throrough assessment, understanding what happened and what really drove the results. Ignoring the warning signs, which the Oilers have done for over a decade now, won’t get them anywhere. What got the Oilers to the western conference finals isn’t going to get them a championship in the future.
Data: Natural Stat Trick
Appendix: Oilers on-ice numbers against the Colorado Avalanche


So, how much of this would you say came down to Draisaitl not being able to move or shoot after the first round, and Nurse getting progressively less mobile as well?
Pingback: The SuperFan Podcast – Episode 45 – Matt Henderson (@Archaeologuy) | The SuperFan
Pingback: Youngster | The SuperFan
Pingback: Previewing the Oilers vs Kings (2023) | The SuperFan