
With the NHL planning to open training camps on July 10th and a playoff format in place, I needed a refresher on how the regular season finished. Mind you, because of the gap between when the season finished due to the pandemic and when the playoffs will hopefully start, it’s pretty much a whole new season. Players have fallen out of their regular season rhythms (i.e., hot streaks, cold streaks), they’ve had time to recover from injuries sustained during the regular season. And coaches are now preparing for playoff competition, which will likely require them to adjust their overall tactics.
Having said that, it’s still worthwhile to see how the Edmonton Oilers finished in relation to the rest of the Western conference, what their strengths and weaknesses were and what progress the franchise made from last season. All of this has to be factored in when continuously making decisions worth millions of dollars, with a championship being the ultimate goal.
From a high-level, we know the Oilers were a good team this season, finishing second in the Pacific division collecting 83 points in 71 games – a respectable 0.585 points percentage. Anything over 0.600 in a regular season, and you’re top 10 in the league and considered a legitimate contender – and the Oilers were close finishing 12th overall. Their +8 goal differential (all situations) was tied for sixth best in the Western conference and third in the Pacific with Arizona.
Here’s how the Oilers compared against the rest of the Western conference. Included in the table is each team’s shot-share numbers at even-strength (5v5) to get a sense of how well they controlled the flow of play and possession (i.e., Corsi For%) and scoring chances (i.e., Fenwick For%), as well as their actual results (i.e., goal-share). I’ve also included each team’s net rate of goals for and against per hour, both on the powerplay and penalty kill, which factors in shorthanded goals. I’ve applied a basic heat map (green is good, red is bad) and sorted the teams by points percentage.
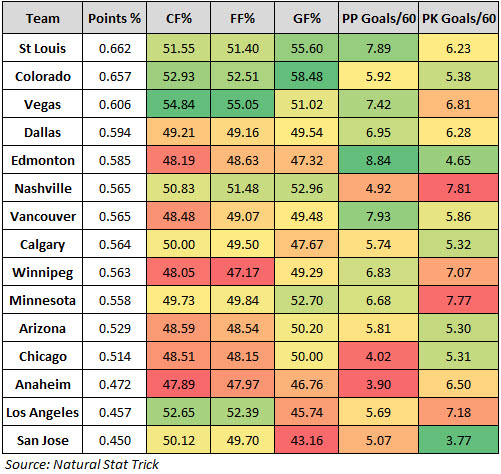
Now we know one of the biggest drivers for the Oilers success this season was their exceptional special teams, as the club finished first in the league on the powerplay scoring 10.64 goals per hour (59 goals-for, 10 goals-against), and second on the penalty kill allowing 5.15 goals against per hour (3 goals-for, 31 goals-against). For context, over the last three seasons prior to 2019/20, the league average rate of goals-for per hour was 7.07 on the powerplay, and about the same rate of goals against on the penalty kill (7.09). The Oilers powerplay generated a slightly below-average rate of unblocked shot attempts, but converted 20.0% of their shots into goals thanks to their high-end skilled forwards. And the penalty kill while allowing the ninth highest rate of unblocked shots against in the league, had the best team save percentage in the league shorthanded (90.61%).
The Oilers were very dependent on their special teams tactics and individual players to bail out their poor even-strength (5v5) results. They finished the season with a -16 goal differential at even-strength, a goals-for percentage of 47.32% (25th in the league) only ahead of the California teams, Ottawa, New Jersey and Detroit. Had the Oilers generated the same number of shots and instead posted a league average team shooting percentage on the powerplay (13.3% over the previous three seasons), they would have scored roughly 20 fewer goals. And had the goaltending been average on the penalty kill, they would have allowed another 13 goals. So instead of a +8 all-situations goal-differential, they’d be at -25 and in the bottom of the league contending for another lottery pick. I know special teams play only makes up about 20% of a team’s total playing time, but boy, it can cover up a lot of deficiencies and make or break an entire regular season.
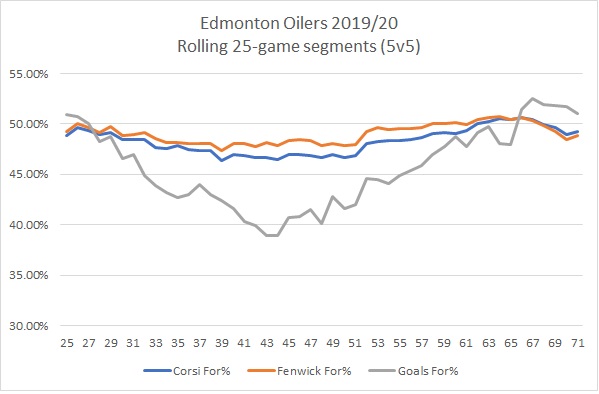
What’s interesting is that while the goal-share results were poor, the Oilers even-strength play wasn’t horrible, having posted shot-share numbers closer to 50% at certain points after the new year. Below are the Oilers Corsi For percentage and Fenwick For percentage in rolling 25-game segments, as well as the actual goal-share which would took a big dive toward the mid-point of the season and what may have prompted tactical changes by the coaching staff at the Christmas break. Note that game 42 was played on December 31st, 2019 against the Rangers.
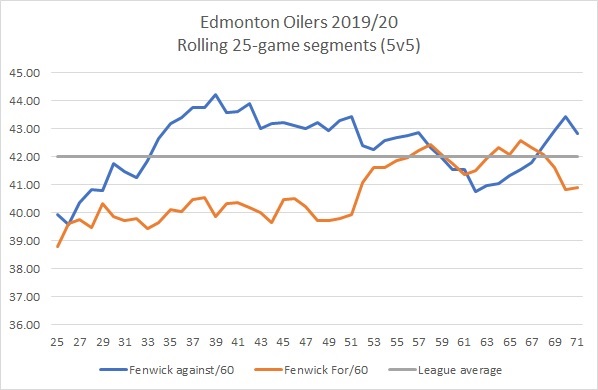
Worth noting that it was on both sides of the puck that the team struggled with early on in the season, and we can’t say for certain that it was completely resolved as they had some issues generating and preventing shot attempts over the final twenty-five games. Below is the team’s rate of unblocked shot attempts (i.e., Fenwick, a proxy for scoring chances) for and against at even-strength over 25-game segments. The gray line indicates the league average rate of unblocked shot attempts for and against from the previous three seasons. Note that allowing 44.00 unblocked shot attempts per hour would have a team in the bottom five league-wide, and the Oilers were one of the worst at preventing chances early in the season and were trending upwards before the league shut down.
So shot-share metrics were mediocre and goal-share results were poor – so what was driving the poor results? Turns out it was really their goaltending at even-strength that sunk them early in the season and cost them games. Below is the team’s shooting and save percentage over rolling 25-game segments to show the input players had on the Oilers actual results (i.e., goal-share) at even-strength.
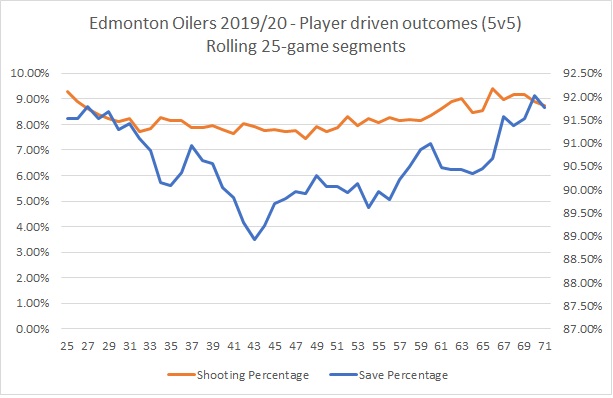
The Oilers team shooting percentage was consistent all year, finishing 13th in the league with 8.43%. Over the previous three seasons, league average shooting percentage has been 7.43%. The team’s save percentage on the other hand, was one of the weak points of the team. The Oilers finished the 2019/20 season with a 91.23 save percentage, 25th overall. Note that over the previous three seasons, the league average team save percentage at even-strength has been 92.17%. Heading into the end of 2019, they had hit a league-worst 89.0% save percentage, which, to the goaltenders’ credit, they did bounce back from posting league average numbers over the final twenty five games of the season.
If the Oilers want to be serious contenders, they need consistent, league average goaltending at even-strength and should be incorporating as much information and data as possible to their off-season decision-making process around the position. That and addressing their poor results at even-strength has to be a focus for management as they can’t count on special teams posting historical numbers every season. And more importantly, they can’t be blinded by the overall success and overlook their roster weaknesses, like the bottom six, and be willing to move out assets if it means making even incremental gains elsewhere. This isn’t a complete roster, and there’s plenty of work to get done this off-season if they ever want to contend for a championship.
Data: Natural Stat Trick

Pingback: CBC Radio Active: NHL set to return to play | The SuperFan
Pingback: Depth perception | The SuperFan
Pingback: The SuperFan Podcast – Episode 15 – Scott Powers | The SuperFan
Pingback: Reviewing the Oilers performance against Chicago | The SuperFan
Pingback: Measuring up | The SuperFan