Something that I’ve been curious about since the Edmonton Oilers were eliminated in the qualifying round of the playoffs was how their 2019/20 regular season compared with top-end teams.
No doubt the Oilers were a good team this past season, finishing second in the Pacific division collecting 83 points in 71 games – a respectable 0.585 points percentage. But while they were close, it didn’t put them in that 100-point zone where teams that finish with at least a 0.600 points percentage in a normal 82-game season would land. That’s the level they need to be at consistently, especially with two superstars signed to long-term deals.
- Related: Re-connecting – The SuperFan (2020, June 16)
The question then is how close were the Oilers to posting numbers similar to teams that have been in the 0.600 point club? When it comes to even-strength, goal-scoring, goaltending – did the team, at any point, post numbers closer to that upper category or were they closer to league average levels?
To figure this out, I first looked at how every team did in their last five regular seasons prior to the 2019/20 season – 2014/15 to 2018/19. That gives us a total of 152 teams, 57 of which finished their regular seasons with a points percentage of 0.600 or more. These are the teams that typically finish at or near the top of their division with 100+ points, and get considered as cup contenders heading into the playoffs. Washington, St. Louis, Pittsburgh, Tampa Bay – they show up at least three times in that five year period. Edmonton shows up once – 2016/17 when they finished with 103 points – and we know how much hype and attention was given to them for those results.
Based on those 57 teams, I wanted to know on average what their goal-share and various shot shares were like like at even-strength and special teams, and if the Oilers ever put together a stretch in their 2019/20 regular season that was around those levels. For comparison, I also wanted to know what the league average numbers were for each metric, and also what the numbers were like for the bottom 50 teams. As you may have guessed, the Oilers show up four times in that group.
Here are the results at even-strength (5v5).
| Group | PTS% | GF% | CF% | xGF% | Sh% | Sv% |
| Top teams | 0.641 | 53.73 | 51.64 | 51.98 | 8.18 | 92.52 |
| League average | 0.558 | 49.99 | 49.99 | 49.99 | 7.76 | 92.24 |
| Bottom teams | 0.453 | 45.45 | 47.68 | 47.32 | 7.36 | 91.92 |
On average, the top teams, the ones that finished their regular season with a points percentage of 0.600 or more, posted a goal-share above 53% at even-strength, often controlling the flow of play, as measured by Corsi For% and generating a higher share of scoring chances, as measured by the Expected Goals For% metric. That really shouldn’t come as a surprise. Teams that get good results and compete for championships are the ones that consistently out-shoot and out-chance opponents.
Quick side note. What I found interesting was how close the more player-driven outcomes, like shooting percentage and save percentage were between the three categories. The margin of error is razor thin in the NHL, with top teams getting on average a team save percentage of 92.52%, while the bottom teams had an average save percentage only 0.60 points below that. Similar case when it comes to shooting percentage. Good teams convert on average 8.18% of their shots into goals, while bottom teams are only 0.82 points below that. It should be obvious to general managers that they have to load their roster with as much talent as possible, and deploy players that drive results in some positive way. Easier said than done of course, but there really can’t be any wastage – optimize that roster and continuously look to improve at every position, no matter how incremental the improvement.
So how did the 2019/20 Oilers compare?
What I’ve done for each metric is graph the Oilers 2019/20 numbers over rolling 25-game segments, and included lines to show the level that a good team, an average team and a poor team is at.
Lets start with the most important one: goal-share at even-strength. We know the Oilers struggled here, finishing the season with a -16 goal differential at even-strength, a goals-for percentage of 47.32% (25th in the league) only ahead of the California teams, Ottawa, New Jersey and Detroit.
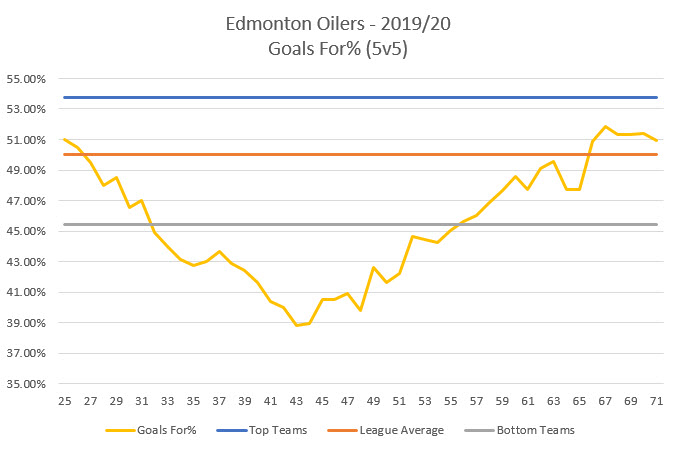
Ghastly results with the team at one point posting a goal-share of less than 40%. But the good news is that the Oilers finished the season well, posting a goal-share of around 51.0% over their final 25 games. Not bad, but as we see in the graph, that’s only slightly above the league average level of 49.99% (orange line) and still below what 100-point teams have posted (blue line). Note that we’ll see what really drove the poor goal-share in a bit.
How about the even-strength shot-share metrics? Below are the 2019/20 Oilers rolling Corsi For% and Expected Goals For% – again with the average levels that a good team (blue line), an average team (orange line) and a poor team (grey line) have posted.

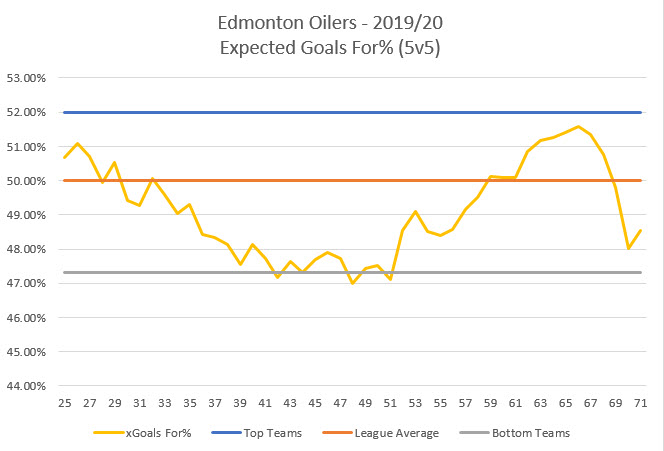
The Oilers finished the 2019/20 regular season 24th in the league when it came to Corsi For% with 48.19% and 22nd in Expected Goals For% with 48.85%. And while they did get back to league average levels near the end of the season, for the most part they hovered closer to what poor teams have posted in the five seasons prior. I know a lot was made about the Oilers performance after the Christmas break and how things turned around, but it still wasn’t good enough. That has to be addressed by both the manager building the roster and the coach that’s charged with tactics and deployment.
Finally, here’s how the Oilers did when it came to the player-driven outcomes: shooting percentage and save percentage.
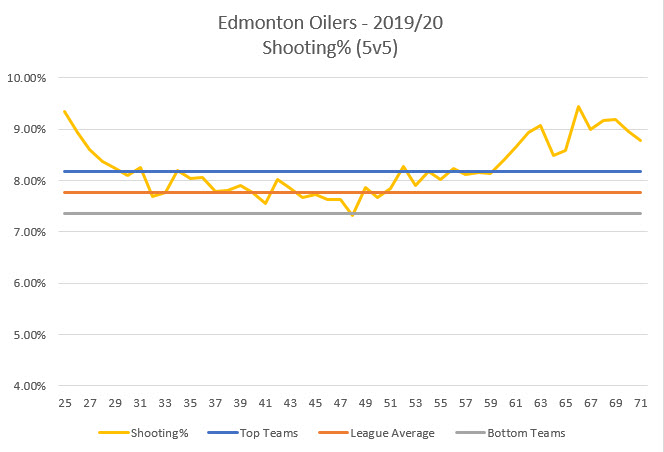
Lets start with the good news. In 2019/20, the Oilers posted a team shooting percentage of 8.43%, which is slightly above the league average. What’s especially encouraging is that at various points of the season, the team’s shooting percentage was close to the scoring rates posted by top teams. The key for the Oilers is to find more scoring talent to surround the superstars with, and really maximize the offence (i.e., shots, scoring chances) that they consistently generate.

On the flip side, the Oilers goaltending was one of the worst in the league in 2019/20 and was well below what even the poorest teams have posted in past regular seasons. Look at the yellow line one more time. That has to be a spot of bother for management, knowing that their decision-making last summer to address the goaltending cost them wins and points in the standings. They need to get it right this summer.
- Related: Evaluating the evaluation – The SuperFan (2020, August 14)
Based on the performances we’ve seen from the top contending teams, there are very clear, tangible targets for the Oilers to work towards. An even-strength goal-share of 52.0%, supported by shot-share metrics above 51.0% is a reasonable goal. And getting league average team shooting and save percentage will take them a long way.
Hopefully the Oilers management is aware of their team’s deficiencies and making decisions this off-season that are geared towards winning games and becoming legitimate contenders. A 100-point regular season, or a points percentage of 0.600 or more, remains the goal and will give us an indication if a championship is in the cards.
Data: Natural Stat Trick
Glossary:
- Points-percentage (Point%) – The total points accumulated divided by the points that were available, including extra time.
- Goals For percentage (GF%) – The proportion of all the goals that the team scored and allowed that the team generated (i.e., Goals For/(Goals For + Goals Against).
- Corsi For percentage (CF%) – The proportion of all the shot attempts the team generated and allowed that the team generated (i.e., Corsi For/(Corsi For + Corsi Against). This is used as a proxy for possession and can predict a team’s future share of goals (GF%).
- Expected goals: Measures the quality of the unblocked shots taken, and assigns a value to it depending on the probability of it becoming a goal. Key variables include the type of shot taken, where it was taken from and compares it to historical shot and goal data to determine the value. (Natural Stat Trick)
- Shooting percentage (SH%) – The percentage of the team’s shots on goal that became goals (i.e., total goals divided by the total shots on goal).
- Save percentage (SV%) – The percentage of the team’s shots on goal against that were saved (i.e., 1-(totals goals allowed divided by the total shots on goal against))
