The Oilers have been an absolute disaster over their last 10 games, winning only twice and getting outscored 21-13 at even-strength (the second lowest goal-share in the league with 38.24%). For a team desperate to make the playoffs, the results have not been there, likely making them sellers at the trade deadline.
- Related: CBC Edmonton News (TV): The Oilers GM search and the upcoming trade deadline + radio spot – The SuperFan (2019, February 21)
What’s interesting is that even though the results haven’t been there, the team is playing considerably better than they were earlier in the season. And it’s reflected in their various shot-share metrics at even-strength (5v5).
| Corsi For% | 50.77% |
| Fenwick For% | 51.33% |
| Shots For% | 50.36% |
| Scoring Chances For% | 53.38% |
| High Danger Scoring Chances For% | 47.87% |
The Oilers for the most part have been a poor shot-share team this season, taking a significant drop since Hitchcock replaced McLellan as head coach, so seeing their numbers above 50% is a positive sign.
One of the main drivers for this has been the return of Klefbom to the line-up. He’s only been back for eight games, but he’s already leading the team in average ice time per game at even-strength. Klefbom is also posting some outstanding on-ice numbers since his return to the line-up, leading all the Oilers regular defencemen when it comes to shot-share metrics: 55.69% Corsi For%, 57.30% Fenwick For%. His return also means a slight decrease in ice time for Nurse and Russell, both of which have struggled this season when it comes to on-ice shot differential at even-strength.
Another factor in these improved on-ice shot shares is the Oilers performance with and without McDavid on the ice over their last 10 games. As you may recall, the entire team, including McDavid of all people, saw their numbers take a significant hit since Hitchcock arrived.
| Last 10 Games (5v5) | CF% | FF% | SF% | SCF% | HDCF% |
| With McDavid | 54.17 | 52.58 | 51.24 | 60.27 | 48.33 |
| Without McDavid | 49.02 | 50.63 | 49.84 | 49.72 | 47.44 |
What’s worth noting is that while the Oilers overall shot-share numbers have improved, it’s largely driven by their declining rate of shots against. The team is still struggling mightily to generate offence.
Below is a graph displaying the Oilers rate of unblocked shot attempts (i.e., Fenwick, a proxy for scoring chances) for and against, broken out into rolling 10-game segments. I’ve included a black line to represent the league-wide average rate of unblocked shot attempts.
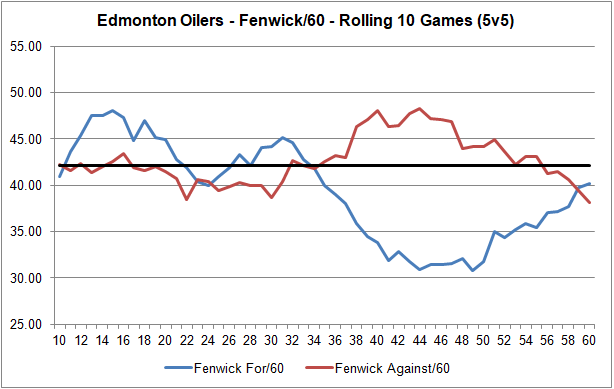
While it’s encouraging to see the rate of unblocked shot attempts against gradually decrease at even-strength, the team continues to fall below the league average when it comes to generating offence. We’re definitely seeing an uptick as we might have expected with Klefbom returning to the line-up, but it remains obvious that the team lacks the talent and depth to compete in the modern NHL. It’s also worth reiterating that the upcoming trade deadline is not the time to find a solution for this significant problem. Better deals can be had in the summer and at the draft, so it’s wiser to acquire picks and prospects for now that can be converted into other, more impactful assets down the road.
Quick note about the special teams: The Oilers powerplay continues to produce, ranking 9th in the league with 8.08 goals per hour. What’s especially encouraging is that they’ve seen an uptick in their rate of unblocked shot attempts for. Over the full season, they rank 18th in the league with 69.43 Fenwicks per hour. However over their last 10 games, they’ve been generating 83.83 Fenwicks per hour. Maintain that level, and we can expect the Oilers to finish the season as one of the top powerplays in the league.
Penalty kill has been a different story. The Oilers are third worst in the league, allowing 8.95 goals against per hour. What’s troubling is that they’re allowing more and more unblocked shot attempts against. Over the season, they’ve been alright ranking 9th in the league with 67.15 Fenwicks against per hour. However in their last 10, they’ve allowed 81.34 per hour – one of the worst in the league.
Data: Natural Stat Trick
Appendix:
- Corsi For% (CF%) – The proportion of all the shot attempts the team generated and allowed that the Oilers generated (i.e., Corsi For/(Corsi For + Corsi Against). This is used as a proxy for possession and can predict a team’s future share of goals.
- Fenwick For% (FF%) – The proportion of all the unblocked shot attempts the team generated and allowed that the Oilers generated (i.e., Fenwick For/(Fenwick For + Fenwick Against). This is used as a proxy for shot quality and considers shot blocking a repeatable skill. It can also predict a team’s future share of goals, slightly better than Corsi.
- Shots For% (SF%) – The proportion of all the shots on goal that the team generated and allowed that the Oilers generated (i.e., Shots For/(Shots For + Shots Against).
- Scoring Chances For% (SCF%) – The proportion of all the scoring chances (as defined by Natural Stat Trick) that the team generated and allowed that the Oilers generated (i.e., Scoring Chances For/(Scoring Chances For + Scoring Chances Against),
- High Danger Scoring Chances For% (HDCF%) – The proportion of all the high danger scoring chances (as defined by Natural Stat Trick) that the team generated and allowed that the Oilers generated (i.e., High Danger Scoring Chances For/(High Danger Scoring Chances For + High Danger Scoring Chances Against),

Pingback: CBC Edmonton News (TV): Oilers winning streak, Draisaitl’s performance and upcoming games | The SuperFan
Pingback: Trending downwards | The SuperFan