With the Oilers currently on a decent run, going 6-3-1 in their last 10 games, it’ll be interesting to see how their recent success will impact the management group’s decision-making process going forward.
The reality of the situation is that the Oilers are a bad team, and have been for most of the season. They currently rank 23rd in the league with 69 points, posting an overall goal-differential of -31. At even-strength (5v5), the Oilers have posted a 47.78% Corsi For percentage, a proxy for possession, and a 47.74% Fenwick For percentage, a proxy for scoring chances – both ranking the Oilers 23rd in the league and one of the worst in the western conference. And while the powerplay has been productive, scoring 7.82 goals per hour (10th in the league), the penalty kill continues to be pathetic, allowing the second highest rate of goals against with 9.14 per hour.
So while the Oilers haven’t been mathematically been eliminated, it’s been fairly obvious for most of the season that this team isn’t good enough to contend for a playoff spot, let alone championship.
Hopefully the Oilers management is aware of the fact that even though their results over their last ten games have been positive – at one point being five points out of a wild card spot – the team has posted only a +1 goal differential (all situations), and have been out-scored 19-17 at even-strength – a goal-share of 47.22%. What’s especially concerning is the team’s underlying shot-share metrics over their last ten games:
| Metric | Games 61-70 |
| Corsi For% | 45.15% |
| Fenwick For% | 44.98% |
| Shots For% | 46.44% |
| Scoring Chances For% | 45.29% |
| High Danger Scoring Chances For% | 46.74% |
Those are shot-shares that would put the Oilers in the bottom five of the league, with teams like Detroit, New Jersey, New York Rangers, Anaheim and Ottawa. It’s a good indication that their recent results are not sustainable, and that to continue having success they would need their goaltending to remain top five in the league. And that’s not exactly a reasonable expectation considering team save percentages often fluctuate and goaltender performances tend to regress towards their career averages.
It’s worth noting that in the ten games prior to this recent stretch, which started right after Peter Chiarelli was dismissed, the Oilers posted their best 10-game stretch when it came to shot-share metrics, but couldn’t get results going 2-5-3 and getting outscored 37-25.
| Metric | Games 51-60 |
| Corsi For% | 50.77% |
| Fenwick For% | 51.33% |
| Shots For% | 50.36% |
| Scoring Chances For% | 53.38% |
| High Danger Scoring Chances For% | 47.87% |
Not the greatest numbers, as they barely broke even when it came to most metrics. But these are the best the Oilers did since Hitchcock’s arrival. Over this stretch, the Oilers were doing well suppressing offence against at even-strength (5v5), allowing 38.1 unblocked shot attempts (Fenwick) against per hour and 29.24 shots on goal against per hour. Unfortunately, their goaltending was slightly below average, posting a team save percentage of 91.06%. Offensively, they were ice cold not only at scoring goals, but also generating shots and scoring chances – an issue that has plagued them all season.
- Related: Trending Upwards – The SuperFan (2019, February 23)
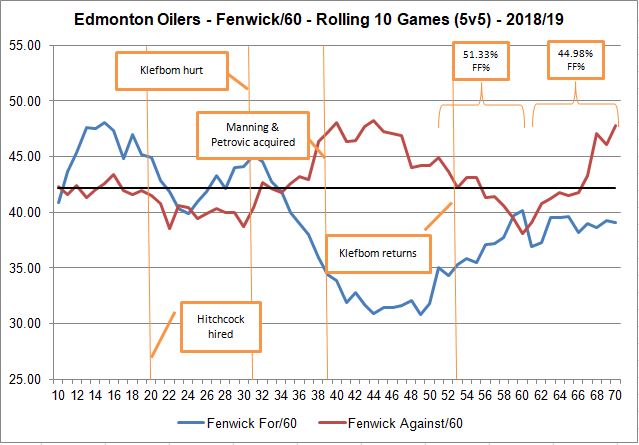
But as we see in the graph below, things got progressively worse over the most recent ten games, especially when it came to the defensive side of things. The team went from allowing 38.1 unblocked shot attempts (Fenwick) per hour to 47.80 per hour – a significant jump going from one of the best in the league to one of the worst. Note, the black line represents the league average rate of unblocked shot attempts for and against this season (42.2).
A couple things.
One, what exactly did the Oilers do that caused this spike in the rate of unblocked shot attempts against? Was there something about their results in games 51-60 that made the coaches adjust their tactical plans? There weren’t any significant changes in how often players were being deployed as the majority of them were playing around the same number and type of minutes across both 10-game segments. Another tell that the team is having deeper systemic issues is the fact that even McDavid posted poor on-ice numbers over this recent ten game stretch (48.61 CF%, 46.74 FF%, 43.75 SCF%).
Second, and more importantly, which segment are the Oilers going to take their lessons from: games 51 to 60 when they did not get results, but were playing well defensively, or games 61 to 70 where the results were there, but likely not sustainable considering how bad they’ve been possession-wise and how badly they’ve been bleeding shots and chances against.
The Oilers management group has to show courage and apply a critical lens on things regardless of the results, and seek a deeper understanding of not only why things happened but also if the results have been real and sustainable. It’s something we know the Oilers have failed to do in the past, but hopefully their approach changes this off-season considering the dire situation the franchise finds itself in.
Data: Natural Stat Trick
Appendix 1: Results over the last 20 games
| Game number | Match | Result |
| 51 | 2019-02-02 – Oilers 4, Flyers 5 | L |
| 52 | 2019-02-03 – Oilers 3, Canadiens 4 | L |
| 53 | 2019-02-05 – Blackhawks 6, Oilers 2 | L |
| 54 | 2019-02-07 – Oilers 4, Wild 1 | W |
| 55 | 2019-02-09 – Sharks 5, Oilers 2 | L |
| 56 | 2019-02-13 – Oilers 1, Penguins 3 | L |
| 57 | 2019-02-15 – Oilers 1, Hurricanes 3 | L |
| 58 | 2019-02-16 – Oilers 2, Islanders 5 | L |
| 59 | 2019-02-19 – Coyotes 3, Oilers 2 | L |
| 60 | 2019-02-21 – Islanders 3, Oilers 4 | W |
| 61 | 2019-02-23 – Ducks 1, Oilers 2 | W |
| 62 | 2019-02-25 – Oilers 2, Predators 3 | L |
| 63 | 2019-02-27 – Oilers 2, Maple Leafs 6 | L |
| 64 | 2019-02-28 – Oilers 4, Senators 2 | W |
| 65 | 2019-03-02 – Oilers 4, Blue Jackets 0 | W |
| 66 | 2019-03-04 – Oilers 4, Sabres 3 | W |
| 67 | 2019-03-07 – Canucks 2, Oilers 3 | W |
| 68 | 2019-03-09 – Maple Leafs 3, Oilers 2 | L |
| 69 | 2019-03-11 – Rangers 2, Oilers 3 | W |
| 70 | 2019-03-13 – Devils 6, Oilers 3 | L |
Appendix 2: Shot-share metrics definitions
- Corsi For% (CF%) – The proportion of all the shot attempts the team generated and allowed that the Oilers generated (i.e., Corsi For/(Corsi For + Corsi Against). This is used as a proxy for possession and can predict a team’s future share of goals.
- Fenwick For% (FF%) – The proportion of all the unblocked shot attempts the team generated and allowed that the Oilers generated (i.e., Fenwick For/(Fenwick For + Fenwick Against). This is used as a proxy for shot quality and considers shot blocking a repeatable skill. It can also predict a team’s future share of goals, slightly better than Corsi.
- Shots For% (SF%) – The proportion of all the shots on goal that the team generated and allowed that the Oilers generated (i.e., Shots For/(Shots For + Shots Against).
- Scoring Chances For% (SCF%) – The proportion of all the scoring chances (as defined by Natural Stat Trick) that the team generated and allowed that the Oilers generated (i.e., Scoring Chances For/(Scoring Chances For + Scoring Chances Against),
- High Danger Scoring Chances For% (HDCF%) – The proportion of all the high danger scoring chances (as defined by Natural Stat Trick) that the team generated and allowed that the Oilers generated (i.e., High Danger Scoring Chances For/(High Danger Scoring Chances For + High Danger Scoring Chances Against).
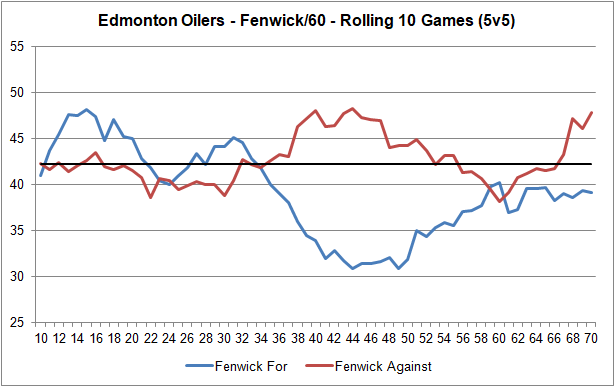
Appendix 3 – Edmonton Oilers, Fenwick/60 (5v5) with key events