
Something that the coaching staff is hopefully aware of is the team’s declining shot-share metrics, considering how poorly their results have been this season. Shot-share values like Corsi (shot attempts), used as a proxy for possession, and Fenwick (unblocked shot attempts), used as a proxy for scoring chances, give us a sense of what a team’s future goal-share could be. Shot-shares serve as good predictive metrics and it makes intuitive sense: if you want to out-score opponents, you need to do a decent job out-shooting and out-chancing them. And if you’re in a tight playoff race, it’s in a team’s best interest to find any edge they can to improve their chances of winning hockey games.
Below are the Oilers rolling shot-share numbers this season, including their share of shot attempts (i.e., Corsi For%), unblocked shot attempts (i.e., Fenwick For%) and shots on goal (Shots For%). I’ve also included the team’s share of scoring chances and high danger scoring chances, as defined by Natural Stat Trick. All numbers are score adjusted.
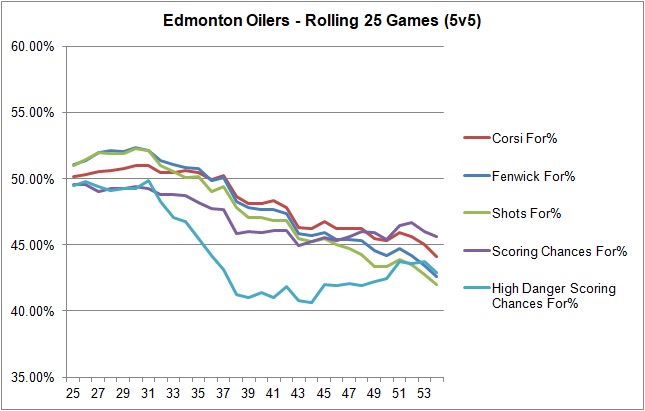
Over their last 25 games, the Oilers are dead last in the league when it comes to Corsi For% (44.13%), Fenwick For% (42.62%) and Shots For% (41.96%). The Oilers are 24th in Scoring Chances For% (45.61%) and 28th in High Danger Scoring Chances For% (42.93%). The Oilers definitely have a flawed roster and they were without Klefbom for an extended period. But the team’s shot-share has to be better than this considering the talent that they do have on the roster and the experience they have behind the bench.
- Related: The Hitch Effect – The SuperFan (2019, January 30)
I was a little more interested in how well the Oilers were getting shots through, so I focused on Fenwick, or unblocked shot attempts. As mentioned, Fenwick is a proxy for scoring chances, and does a decent job of predicting future goal-share.
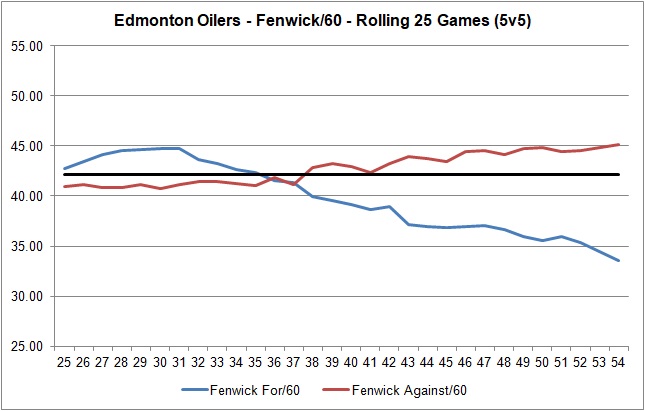
Note that I’ve added a black line to represent the league average rate of Fenwick For per hour and Fenwick Against per hour, which is 42.1. And while the rate of Fenwick Against per hour gradually increased, it’s their rate of Fenwick For per hour over their last 25 games which ranks them dead last in the league. For all the grief that the Oilers deservedly getting for allowing goals, I don’t feel like enough has been written about the team’s lack of offence.
Also worth knowing how individual players have been doing. Below are the Oiler forwards who have played at least 40 minutes at even-strength (5v5) over the last 25 games, including their on-ice Fenwick For% (FF%), Goals For% (GF%), On-ice shooting percentage (SH%), On-ice Save percentage (SV%) and PDO. List is sorted by Fenwick For%.
| Player | GP | TOI | FF% | GF% | On-Ice SH% | On-Ice SV% | PDO |
| Kassian | 25 | 308.9 | 46.50 | 54.88 | 10.26 | 92.38 | 1.026 |
| Spooner | 15 | 118.4 | 45.63 | 40.96 | 4.36 | 95.50 | 0.999 |
| Brodziak | 24 | 249.2 | 45.12 | 30.51 | 3.80 | 92.98 | 0.968 |
| Lucic | 25 | 291.1 | 44.81 | 55.78 | 11.19 | 92.66 | 1.038 |
| Cave | 6 | 44.4 | 43.88 | 0.00 | 0.00 | 88.06 | 0.881 |
| McDavid | 25 | 435.3 | 43.41 | 47.12 | 13.00 | 89.44 | 1.024 |
| Draisaitl | 25 | 410.8 | 43.41 | 51.63 | 13.31 | 90.81 | 1.041 |
| Puljujarvi | 25 | 287.3 | 43.13 | 31.64 | 7.64 | 88.03 | 0.957 |
| Rieder | 22 | 230.7 | 42.90 | 20.90 | 2.09 | 94.06 | 0.961 |
| Caggiula | 6 | 57.9 | 42.85 | 43.69 | 19.27 | 83.93 | 1.032 |
| Chiasson | 22 | 287.9 | 41.25 | 41.55 | 10.52 | 90.88 | 1.014 |
| Rattie | 16 | 190.1 | 40.32 | 42.19 | 8.59 | 91.70 | 1.003 |
| Yamamoto | 5 | 45.7 | 39.73 | 14.64 | 4.73 | 80.41 | 0.851 |
| Khaira | 23 | 272.5 | 38.81 | 35.92 | 8.52 | 89.68 | 0.982 |
| Nugent-Hopkins | 25 | 333.1 | 37.85 | 42.13 | 14.24 | 88.35 | 1.026 |
Keep these in mind when the coaching staff tries to hype up their players to the media heading into the deadline. And for all the talk we’ve heard from Hitchcock about offensive zone time, there doesn’t seem to be a whole lot considering guys like RNH are posting a 37.85% on-ice Fenwick For percentage. Also makes you also wonder how many more points McDavid or Draisaitl could get if their team had the puck more often.
And here’s how the defencemen have fared over the Oilers last 25 games. List is sorted by Fenwick For% (FF%).
| Player | GP | TOI | FF% | GF% | On-Ice SH% | On-Ice SV% | PDO |
| Klefbom | 4 | 64.18 | 51.36 | 0.00 | 0.00 | 96.08 | 0.961 |
| Larsson | 25 | 476.62 | 45.00 | 35.91 | 8.73 | 87.62 | 0.963 |
| Manning | 11 | 134.75 | 44.71 | 45.16 | 10.83 | 90.43 | 1.013 |
| Benning | 22 | 285.40 | 44.02 | 57.06 | 10.49 | 93.58 | 1.041 |
| Nurse | 25 | 491.43 | 42.50 | 48.11 | 12.00 | 90.46 | 1.025 |
| Jones | 17 | 290.47 | 42.34 | 35.01 | 9.05 | 87.49 | 0.965 |
| Gravel | 17 | 247.68 | 41.36 | 43.55 | 6.93 | 94.02 | 1.009 |
| Russell | 15 | 266.58 | 40.85 | 42.27 | 9.54 | 91.13 | 1.007 |
| Petrovic | 6 | 83.43 | 32.77 | 0.00 | 0.00 | 88.17 | 0.882 |
Definitely a lot of work to do if the Oilers want to secure a playoff spot. With Klefbom back in the line-up and getting into form, the team should see an uptick in their shot-share numbers. But the coaching staff will need to optimize their roster as much as possible, ideally deploying three scoring lines, and find any edge they can to increase their probabilities of winning games.
And if these shot-share numbers are the best the Oilers can do, then it’s in the team’s best interest to start making moves geared towards winning games next season. That means dealing away unrestricted free agents like Chiasson, Talbot and Petrovic at the deadline for prospects and picks. And exploring the market for guys like Kassian, Brodziak and Manning, and even players like Nurse and Russell whose perceived values are higher than their actual values. Rather than standing pat right now knowing the team isn’t competitive enough, the Oilers could get a jump start on getting things on track and start competing for a championship in the near future.
Data: Natural Stat Trick

Pingback: Reality Check | The SuperFan
Pingback: Trending Upwards | The SuperFan