Tracking the Pacific Division – As of November 30, 2018

hkn-knights-oilers-20181118

Following up to my post from the end of October where I looked at the Pacific division and each team’s underlying numbers.

Heading into Saturday night’s game at home against Vegas, the Oilers were fifth in their division with 26 points. The Flames are sitting in first with 32 points, and a +14 overall goal differential. The Ducks, thanks to their exceptional goaltending, are second with 31 points but have a -14 goal differential. Amazing. San Jose – who were expected to run away with the division are third with 29 points and a -2 overall goal differential.

Here’s how the Pacific division teams have done as of November 30, 2018. An explanation of each metric can be found in the glossary at the end of the article.

Pacific Division - 20181130

Couple notes:

  • At even-strength (5v5), the Edmonton Oilers have been good possession-wise, ranking 12th in the league when it comes to Corsi For percentage and Fenwick-for percentage. Their goaltending has been fine as well, ranking 13th in the league thanks to the play of Mikko Koskinen. The Oilers are doing well defensively, ranking 9th in the league when it comes to the rate of unblocked shot attempts (i.e., Fenwick) with 40.75 per hour and ranking 10th when it comes to the rate of high danger shot attempts with 10.47 per hour. Most importantly, the Oilers rank 10th in the league in goals against per hour with 2.24 per hour.
  • The biggest and most alarming issue for the Oilers is goal-scoring. They’ve only scored 38 goals at even-strength, a rate of 1.90 per hour which ranks them 4th worst in the league. The only teams they’re ahead of? Anaheim, Arizona and Los Angeles – all division rivals.
  • One more thing about goal-scoring – over the last two seasons, the Oilers have never posted a 25-game stretch where they’ve scored lower than 2.00 goals per hour. This really is incredible considering that they’re top players are all healthy. Part of the issue is luck, as their shooting percentage is below team averages. The big problem of course is the lack of talent on the wings, something that needs to be addressed as soon as possible.
  • The teams that are currently strongest possession-wise are Calgary, San Jose and Vegas. Arizona started off strong, but their possession numbers have dropped since the end of October, while Calgary has gradually improved.
  • When it comes to powerplays, the Oilers are tops in the Pacific and sixth league-wide with 8.73 goals per hour. San Jose is 11th and Calgary is 13th. When it comes to penalty kills, Arizona and San Jose are one and two respectively league-wide allowing less than 4.5 goals against per hour. Calgary, Vancouver and Los Angeles are among the league’s worst.
  • While Calgary’s goaltending appears to have improved, both San Jose and Vegas are having issues with theirs. San Jose has a -10 goal differential at even-strength and Vegas has a -7 goal differential – remarkable considering the amount of hype around both teams in the off-season.
  • Among 38 goalies who have played at least 450 minutes at even-strength this season, Sharks goaltender Martin Jones ranks last with a save percentage 88.1%. And Marc-Andre Fleury ranks 32nd with a save percentage of 90.7%. It’ll be something to keep an eye on as both clubs have high expectations and may need to explore the goalie market to ensure they have success.

Data: Natural Stat Trick

Glossary:

  • Points percentage (PTS%) – The total points accumulated divided by the points that were available, including extra time.
  • Goals-for and Goals-against (GF/GA) – The number of goals scored and the number goals allowed at even-strength.
  • Goal Differential (Goal +/-) – The difference between the goals scored and the number of goals allowed (i.e., goals-for minus goals-against)
  • Corsi For percentage (CF%) – The proportion of all the shot attempts the team generated and allowed that the team generated (i.e., Corsi For/(Corsi For + Corsi Against). This is used as a proxy for possession and can predict a team’s future share of goals (GF%).
  • Fenwick For percentage (FF%) – The proportion of all the unblocked shot attempts the team generated and allowed that the team generated (i.e., Fenwick For/(Fenwick For + Fenwick Against). This is used as a proxy for shot quality and considers shot blocking a repeatable skill. It can also predict a team’s future share of goals, slightlty better than Corsi.
  • Shots For percentage (SF%) – The proportion of all the shots on goal that the team generated and allowed that the team generated (i.e., Shots For/(Shots For + Shots Against).
  • Scoring Chances For percentage (SCF%) – The proportion of all the scoring chances that the team generated and allowed that the team generated (i.e., Scoring Chances For/(Scoring Chances For + Scoring Chances Against),
  • Goals For percentage (GF%) – The proportion of all the goals that the team scored and allowed that the team generated (i.e., Goals For/(Goals For + Goals Against).
  • Shooting percentage (SH%) – The percentage of the team’s shots on goal that became goals (i.e., total goals divided by the total shots on goal).
  • Save percentage (SV%) – The percentage of the team’s shots on goal against that were saved (i.e., 1-(totals goals allowed divided by the total shots on goal against))
  • PDO – The sum of a team’s shooting percentage (SH%) and its save percentage (SV%). It’s based on the theory that most teams will ultimately regress toward a sum of 100, and is often viewed as a proxy for how lucky a team is. (Source)

CBC Edmonton News (TV): Recent success, expectations under Hitchcock, lack of scoring and goaltending + notes

cbc edmonton logoI joined host Sandra Batson on the CBC Edmonton News for my weekly segment to discuss all things Oilers. Clip is here and starts at the 17:55 mark: CBC Edmonton News (2018, November 29)

Topics we covered:

  • Recent stretch of games, and what the positives have been.
  • What we can expect from the Oilers with Hitchcock behind the bench.
  • The Oilers goaltending situation with Koskinen starting again tonight, and what this can mean for Cam Talbot.
  • Goal-scoring issues and what the Oilers should do to address it.
  • Preview of tonight’s game against Los Angeles.

Notes:

  • While it’s great that the team is banking points, the Oilers should be concerned with the fact that they’re constantly in one-goal games and often needing overtime to collect the extra point. Couple articles I found helpful in the past and their key findings:
    • Clear victories, which are victories by two or more goals (non empty-net), “are a better indicator of talent level than a team’s overall record, and much better than a team’s record in one-goal games” (Source: Copper & Blue)
    • Also: “There’s almost no relationship between winning (or losing) a lot of one goal games in one season and winning (or losing) a lot the next season.  There’s a reasonably strong relationship between wins by two or more goals from year-to-year, though.  It’s pretty clear which is an indication of real talent and which is mostly chance.” (Source: Pension Plan Puppets)
  • I also mentioned the work I did last week about Ken Hitchcock, and his history with special teams.
  • Goaltending numbers worth keeping an eye on:
    • Even-strength (5v5)
      • The Oilers team save percentage at even-strength isn’t bad. They currently rank 13th in the league with 92.23%. It’s their save percentage on the penalty kill that’s bad, ranking 25th with 82.61%. More on that below.
      • Among 39 goalies who have played at least 450 even-strength (5v5) minutes (roughly 10 games) this season, Koskinen ranks 9th with a save percentage of 93.5%. Talbot ranks 26th with a save percentage of 91.5%. Average save percentage among the group of 39 is 92.2%.
      • When it comes to high danger save percentage (5v5), Koskinen ranks 17th with 84.2%. Talbot ranks 21st with 83.7%. Average high danger save percentage among the group of 39 is 83.6%.
    • Penalty kill (4v5):
      • Among 36 goalies who have played at least 50 minutes shorthanded, Koskinen ranks 5th with a 93.0% save percentage. Talbot ranks last with a save percentage of 73.5%. Average save percentage among this group is 87.75%.

  • Can’t emphasize enough how it’s the Oilers’ lack of scoring talent that’s sinking them right now. They’ve only scored 37 goals at even-strength, the third lowest total in the league, for a goals-for per hour rate of 1.93. They rank 28th in the league with a 6.18% shooting percentage. They’re right around league average when it comes to generating unblocked shot attempts (a good proxy for shot quality), but just can’t finish.
  • How the team addresses their scoring issue is going to be interesting. I doubt that guys like Yamamoto or Puljujarvi are the answer – they might be another year away from being dependable NHLers. And I don’t think the third or fourth lines have enough talent to squeeze out a few goals. Best bet is to part with an asset, maybe a pick or a prospect, but it’ll probably require a roster player to land a good scoring winger.
  • This is where the Oilers need to get creative. One player that I mentioned on the newscast as potential trade-bait was Darnell Nurse. Mostly because his perceived value on the market is likely far, far higher than his actual value. His numbers have not been good this year, and I’m not convinced he’s anything more than a second or third pairing player.

Data: Natural Stat Trick

Hitchcock’s history with special teams

hitchcock_ken

Out of curiosity, I wanted to know what Ken Hitchcock’s history has been on the powerplay and the penalty kill. Fact is, the Oilers are coming off a dreadful  season that was sunk in large part by their poor special teams. This season, things haven’t gone so well either. Prior to Hitchcock’s hiring, the Oilers ranked 16th in the league on the powerplay (5v4), with a goals for per hour rate of 7.72, and 25th in the league on the penalty kill (4v5), allowing 8.69 goals against per hour.

Worth noting that the penalty kill has done a good job prior to Hitchcock’s hiring at limiting shots and chances against, but their goaltending has sunk them.  The results have been poor, but I don’t think it’s because of the process they have in place. The powerplay on the other hand is average and average for good reason as they struggle to generate shots consistently. Considering how much talent they have, their current results and underlying numbers are unacceptable.

Two numbers that I rely on when looking at special teams: goals and unblocked shots.

Goals are what wins and loses you games – those are the actual results so it’s obviously important. Unblocked shots  (i.e., Fenwick – also a proxy for shot quality) is what teams are trying to generate on the powerplay and limit on the penalty kill, and it’s largely driven by coaching and the tactics they employ. Goals on the powerplay can be driven by individual talent – players go hot and cold, and we know how random goal-scoring can be sometimes. On the penalty kill,  same thing, but it’s the individual talent between the pipes that can hide a team’s deficiencies and prop up positive results. That’s why I look at shot metrics, as they  can give you some insight on whether or not the results on the powerplay or penalty kill are real.

When pulling goals and shots, I look at rate stats to gauge how efficient a team is on special teams. We know that not all teams take and draw the same number of penalties. And looking at goals and Fenwick at a per-60 rate gives us a better idea of how efficient a powerplay or penalty kill unit was.

Since we only have access to Fenwick numbers on powerplays and penalty kills from 2007 on-wards, I only looked at three of Hitchcock’s four seasons in Columbus, his full six year run in St. Louis, and his one-year stint in Dallas last season.

Powerplay (5v4)

Below are Hitchcock’s results on the powerplay since 2007.

Team Season Fenwick For/60 Goals For/60
CLB 2007/08 58.54-23rd 4.98-25th
CLB 2008/09 65.93-25th 4.63-29th
CLB 2009/10 69.76-17th 6.24-15th
STL 2011/12 75.96-6th 6.33-12th
STL 2013 73.08-4th 7.08-7th
STL 2013/14 67.54-20th 6.73-6th
STL 2014/15 76.33-7th 7.89-4th
STL 2015/16 60.11-30th 8.10-1st
STL 2016/17 69.52-24th 7.46-9th
DAL 2017/18 79.32-10th 6.99-17th

Notes:

  • He had some fantastic results in St. Louis, but I suspect it was largely driven by the individual talent on his teams. As a group, the Blues didn’t always do a good job at generating unblocked shots and instead relied on above average team shooting percentages. That 2015/16 season was interesting – they were last in the league at generating shot attempts, but still managed to finish with the best powerplay in the league – thanks to a 18.59% shooting percentage, the highest rate a team has posted in a full season since 2007.
  • Hitchcock’s results on the powerplay in Columbus weren’t very good. They finisihed near the bottom of the league,  and struggled to generate a lot of offence. Prior to being fired in his fourth season there, the club had improved and was right around league average when it came to goals and shots.
  • The powerplay in Dallas appears to have been a little unlucky. They were 10th in the league at generating shots, and did well in generating chances from the high danger area. But their team shooting percentage finished in the bottom third of the league. The numbers they posted on the powerplay under Hitchcock were pretty close to the numbers they posted the year before when Lindy Ruff was behind the Stars bench.

Penalty Kill (4v5)

Below are Hitchcock’s results on the penalty kill since 2007.

Team Season Fenwick Against/60 Goals Against/60
CLB 2007/08 61.89-10th 5.47-10th
CLB 2008/09 68.18-10th 6.25-11th
CLB 2009/10 69.09-15th 6.71-22nd
STL 2011/12 60.67-5th 3.44-3rd
STL 2013 52.82-2nd 4.89-5th
STL 2013/14 61.69-3rd 4.54-2nd
STL 2014/15 63.73-2nd 5.43-8th
STL 2015/16 70.46-13th 4.58-3rd
STL 2016/17 66.47-9th 6.49-20th
DAL 2017/18 72.73-8th 6.64-13th

Notes:

  • Outstanding results pretty much anywhere he goes.
  • Hitchcock regularly has his team in the top 10 when it comes to the rate of unblocked shot attempts against.
  • The year before he got to Dallas, the Stars had one of the worst penalty kills in the league, allowing the most goals per hour and were mediocre when it came to limiting shots against. It did also help Hitchcock to have Ben Bishop in net for most of the games, compared to the season prior when Ruff only had Lehtonen and Niemi.
  • For my own interest, I looked into how well Hitchcock’s clubs have done at generating shot attempts when shorthanded – just to get a sense of how aggressive his teams play. His teams have typically been below average in this regard, so I don’t expect a spike in shorthanded goals.

Thoughts

  • Hitchcock’s results on the penalty kill have been excellent, and they’ve been real. It’s true he’s had some very good goaltending over the years, but his teams have regularly been top five defensively limiting shots and high danger chances. Hopefully he can implement some of that in Edmonton. Wonder how Trent Yawney feels.
  • The powerplay is an area that I think Hitchcock should lean on Manny Viveiros for, as his assistant has had powerplay success in his prior coaching stints. Hitchcock hasn’t had the greatest success when it comes to generating chances, and he could get away with it in Edmonton with McDavid running things. But it’d be in the team’s best interest to have two effective units that consistently generate shots and hopefully goals.
  • One thing worth seeing after another 20 games or so is how much different Hitchcock deploys certain players and forward and defensive tandems on the powerplay and penalty kill compared to McLellan.
  • At the end of the season, it’ll be interesting to compare the Oilers results under Hitchcock with the results under McLellan. Here’s how the Oilers fared over the three full seasons with McLellan behind the bench:
2015-2018 Fenwick For/60 Goals For/60
Powerplay 74.47-14th 6.44-18th
2015-2018 Fenwick Against/60 Goals Against/60
Penalty Kill 72.34-12th 7.09-24th

Any feedback, let me know.

Data: Natural Stat Trick

CBC Edmonton News (TV): Coaching change, acquiring Wideman and Spooner, and previewing the upcoming games + other notes

cbc edmonton logoI joined host Alicia Asquith on the CBC Edmonton News for my weekly segment to discuss all things Oilers. Clip is here and starts at the 15:00 mark: CBC Edmonton News (2018, November 22)

Topics we covered:

  • The hiring of Ken Hitchcock, and what we can expect from the new head coach.
  • The key factors that lead to Todd McLellan’s dismissal, including the general manager’s poorly constructed roster.
  • The acquisition of Ryan Spooner last weekend and Chris Wideman earlier today, and what to expect from each player.
  • The upcoming games against Anaheim and Los Angeles, and really how poor the Pacific division has been.

Couple other thoughts bouncing around in my drafts that I haven’t converted into articles.

Coaching change

  • This does not appear to be a Peter Chiarelli hire. I’d speculate that the decision to bring in Ken Hitchcock came from higher up. And it signals, to me at least, that the team is now evaluating the general manager’s work.
  • I think Chiarelli’s preference would’ve been to replace McLellan with one of the experienced assistant coaches that he hired in the summer.
  • I understand why the head coach had to be replaced. The results weren’t there, and we didn’t see enough progress from some of the higher-end draft picks like Yamamoto and Puljujarvi. He didn’t line match, and I don’t think he put together optimal line combinations. It doesn’t help either when the roster he was given had so many flaws, so many holes. And I get the sense he was pressured by management to play Lucic in the top six and do everything he could to have Draisatl center his own line.
  • Not absolving McLellan for the team’s poor results, but there’s a lot of external factors that I hope Hitchcock, or the future coach, doesn’t have to put up with.
  • If the organization was committed to the management group, I think there would’ve been a more exhaustive search, lead by the general manager, to find the next head coach.
  • I’m really curious to see how much the shots against drop with Hitchcock behind the bench. The Oilers are league average right now when it comes to shots, unblocked shot attempts and scoring chances against per hour. Worth tracking after another 20 games.

Strome/Spooner trade

  • I didn’t understand the Strome-for-Spooner trade before the coaching change. I especially don’t understand it now. The trade itself came across to me as something the coach influenced, perhaps thinking that Cooper Marody could slide into that third line center spot. And that an additional winger who has some speed would help the team.
  • One line I wanted to see was Strome with Marody and Khaira. Wasn’t going to happen because Lucic was stapled to Strome’s wing, and he wasn’t going to be on the fourth line or healthy scratched. Aaand now we definitely won’t see it.
  • Can’t help but wonder how Hitchcock would’ve handled a player like Strome had the trade not been made. Strome is such a non-event player; he doesn’t create much and doesn’t allow much against either. I would think he’d have found a spot in the top six on the wing or maybe remain as a third line pivot and a key penalty killer.
  • I had a good laugh when I noticed that Spooner’s career shooting percentage is just as lame as Strome’s. I was hoping that maybe Spooner would be closer to league average and that maybe he could find some success playing with RNH on the second line. Expectations are fairly low at this point for Spooner.

Shooting percentage

  • I suspect we’ll see the team’s shooting percentage at even-strength gradually improve, and the credit will automatically go to the new head coach. Heading into Tuesday’s game in San Jose, the Oilers ranked 26th in the league with a 6.60% shooting percentage. They’re 13th in terms of generating shots on goal (31.62 shots per hour).
  • The team’s high danger shooting percentage is also extremely low. They’re 29th in the league with a 13.19% shooting percentage. I want to think that they should improve since they’re right around league average when it comes to high danger shot attempts per hour. The problem is they don’t have enough skill outside of McDavid, RNH and Draisaitl to be finishers. Currently the top two players in terms of individual high danger shot attempts per hour are Rattie and Caggiula – not exactly the most talented guys that strike fear into goalies.

Such a brutal spot that the Oilers are in right now. They need to change how they operate and how they assemble a roster, but that’s only going to happen if they overhaul their management group, and even make some changes to the executive group above the general manager. So much potential being wasted. In my opinion, they need to start changing their overall approach and strategy right away and get a jump on things for next season.


Tobias Rieder’s injury and its impact to the Oilers penalty kill

coppernblue.com.full.54273Some bad news for the Edmonton Oilers as the club announced that they will be without the services of Tobias Rieder for one month. The winger suffered an upper-body injury in Tuesday night’s win against Montreal (Source).
In 18 games this season, Rieder has played predominantly on the second line alongside Leon Draisaitl, registering seven assists. Five of those assists have come at even-strength (5v5), giving him a points per hour rate of 1.53 – ranking him seventh on the team among forwards.

While his offensive output hasn’t been great, it’s his versatility on the roster that will be missed the most.

”It’s a blow that hurts us in a number of different areas. He became a very trustworthy player for us. A very solid defensive player, one that you could put out in any situation. Up front, he was creating well while maintaining that responsible aspect of the game.” – Todd McLellan (Source: Edmonton Oilers)

Rieder has been deployed as part of the second powerplay (5v4) unit this season, as well as the penalty kill (4v5) where he ranks just behind second on the team in the number of minutes played shorthanded (28:24) and the average number of minutes played per game (1:34).

Considering how poor the special teams were last season, and how it impacted their final results, it’s critical to assess what Rieder’s absence will mean to the team as they try to remain competitive.

Full article is at The Copper & Blue.

CBC Edmonton News (TV): Bounce back win against Montreal, McDavid-Draisaitl tandem and more

cbc edmonton logoI joined host Kim Trynacity on the CBC Edmonton News for my weekly segment to discuss all things Oilers. Clip is here and starts at the 14:20 mark: CBC Edmonton News (2018, November 14)

Topics we covered:

  • Tuesday night’s win against Montreal, and what went well for the Oilers.
  • The tandem of McDavid-Draisaitl, their success together, but also the issues around roster construction and scoring depth.
  • The current state of the Oilers defence and Chiarelli’s recent comments about lacking a puck mover on the blueline.
  • The importance of improving their powerplay.
  • Important game against Calgary on Saturday night and playing Pacific division rivals seven times in the next eight games.

I also joined Adrienne Pan on CBC Radio Active on Tuesday afternoon. Will post a link if it becomes available.

Optimizing the powerplay

oscar-klefbom-connor-mcdavid

One of the most interesting things about this Oilers season has been the powerplay (5v4). It’s a critical area for the team, as they finished dead last in 2017/18 and the team tried to address it in the summer by revamping the coaching staff. The team isn’t exactly a powerhouse at even-strength due to the lack of talent and depth (especially on the wings) – so it’s going to be important for the powerplay to consistently produce if they want to contend for a playoff spot.

The good news so far is that the team currently ranks 12th in the league when it comes to the rate of goals for per hour (GF/60) with 7.81, scoring 12 times. The fact that McDavid has nine powerplay points (5 goals, 4 assists – three of which were primary assists) should tell you all you need to know about who has been the offensive driver. Draisaitl and Nugent-Hopkins, who each have seven points, along with Klefbom are the go-to unit with McDavid playing around 65 of the Oilers total 92 powerplay minutes this season. The roughly 25% of the remaining powerplay time has been left for Ryan Strome and really whoever else the coaching staff feels like throwing out there.

The team as a whole isn’t doing a great job of generating unblocked shot attempts (69.67 FF/60, 19th in the league), relying more on a team shooting percentage that’s currently at 16.0%. The average team shooting percentage over the last three seasons has been 12.58, so we’ll see how long the Oilers can convert at the rate that they’re currently at.

It’s really when the first powerplay unit is on the ice that the team gets going, generating over 80 unblocked shot attempts per hour – a rate that would have them among the league’s best. And they’ve scored 10 of the teams 12 powerplay goals –  a rate of 8.84 goals per hour – which isn’t bad but really should be better considering the talent that they have.

When the second powerplay unit is deployed, it’s been dreadful – generating 39.51 unblocked shot attempts and only scoring twice (a rate of 4.94 goals per hour). It’s easy to tell why the coaching staff is giving close to 75% of the total powerplay time to the first unit.

Couple things that I think the team needs to address.

First off, the first powerplay unit is heavily relying on Nugent-Hopkins, who is also getting regular minutes on the penalty kill (4v5) and also Draisaitl, who is gradually getting more reps shorthanded. Knowing what we know about recovery time, sport science, and the importance of rest for professional athletes, I’m not sure if it’s a good idea to have your best players spending so much of their energy on both special team units. Both RNH and Draisaitl are probably young enough to handle it, but it’d probably be in the team’s best interest if the workload was distributed.

It’d really help if the coaching staff had a stronger second powerplay unit, not only to take the load off the first powerplay unit, but to also have fresher legs on the penalty kill. The team really is lacking a special teams specialist on their fourth line, similar to what they had in Letestu who at one point was really effective on the powerplay. I don’t think these commodities are hard to find; some simple research and scouting can probably uncover these.

I think a big reason why the Oilers first powerplay unit is able to consistently generate shots and chances is because they’re working the puck down low to set up the forwards. And of course it makes total sense – the talent is there up front so get the pucks to them and get shots from high probability locations. What I’ve found is that the second powerplay unit isn’t nearly as effective at getting shot from the more high danger areas – instead relying more on shot attempts form the defencemen at the point. The concept is a pretty dated one – work the puck up top, get a shot from the defenceman and look for rebounds. Unfortunately, that’s not really making the best use of your time as your chances of scoring goals are much higher when the puck is in close coming from players with scoring talent.

Using Klefbom as our proxy for the top powerplay unit, the Oilers have generated 109 shot attempts (i.e., Corsi). And of those 109 shot attempts, 18 have come from the stick of Klefbom – coming out to 16.5%. When Klefbom isn’t on the ice, the team has generated 36 shot attempts, with 15 of those coming from the stick of one of the other defencemen – a proportion of 41.7%. Ideally, the Oilers would have enough talent up front on their second powerplay unit so they’re not taking this high of a proportion of low probability shot attempts. In my mind, the team needs to fix their overall powerplay tactics and find a way to balance their first and second units.

One last thing: the drop in the rate of unblocked shot attempts from the first powerplay unit to the second powerplay unit is massive, a difference of 40.96. I took a quick look at last year’s data, comparing each team’s first and second powerplay units (using each team’s top forward in terms of ice time as a proxy) and their rate of unblocked shot attempts. On average, a team’s rate of unblocked shot attempts dropped by 18.35 when their second powerplay unit was deployed. Only one team had a drop of more than 40 unblocked shot attempts and that was the Sabres who finished 24th in the league in terms of goals for per hour.

While the team is doing alright generating goals on the powerplay, I think it’s imperative that they put a critical lens on things and find ways to sustain their success. I don’t think what they’re doing right now is sustainable, and there are significant ramifications to the team’s overall success if they don’t make adjustments.

Data: Natural Stat Trick

CBC Edmonton News (TV): Current losing streak, Lucic’s fine, player development and game preview

cbc edmonton logoI joined host Sandra Batson on the CBC Edmonton News for my weekly segment to discuss all things Oilers. Clip is here and starts at the 18:40 mark: CBC Edmonton News (2018, November 8)

Topics we covered:

  • The back-to-back losses in Washington and Tampa and tempering expectations.
  • Lucic’s actions against the Lightning and the fine he received.
  • The development of Yamamoto and Puljujarvi and why Bakersfield would be a good spot for both of them.
  • The Oilers goaltending, how it’s been alright at even-strength but not so good on the penalty kill.
  • Preview of tonight’s game, and why the Oilers shouldn’t be taking the Panthers too lightly.

Any feedback, let me know.

Hindering offence

coppernblue.com.full.54273A quick follow up to something I found last week when digging into Oscar Klefbom’s early season numbers.

To re-cap, with Klefbom on the ice with him this season at even-strength (5v5), McDavid’s on-ice Corsi For percentage (i.e., a proxy for possession) was 55.08% – a great proportion, right around where we would expect things to be when an elite forward is on the ice with a very good offensive-minded defenceman. And for good reason, we’ve seen the coaching staff play Klefbom as much as possible this year with the top offensive forwards to squeeze out every bit of offence possible.

Now I was expecting both players to post a a slightly lower Corsi For percentage without one another, but was surprised to see McDavid take a significant hit – dropping down to a 45.94% on-ice Corsi For percentage without Klebom this season. Below is what the results were after 13 games.

  • McDavid with Klefbom (111 mins) – 55.08% CF%, 75.0% GF% (6 GF, 2 GA)
  • McDavid without Klefbom (101 mins) – 45.94% CF%, 66.67% GF% (4 GF, 2 GA)
  • Klefbom without McDavid (129 mins) – 55.17% CF%, 62.50% GF% (5 GF, 3 GA)
  • Oilers without Klefbom or McDavid (271 mins) – 46.40% CF%, 35.0% (7 GF, 13 GA)

Knowing what we know about McDavid and his ability to drive offence, I think it’s fair to assume that something is dragging him down – either the play of an individual player or perhaps the team’s overall tactics. The fact that Klefbom’s Corsi For percentage has stayed above 55.0% without McDavid made me focus on McDavid’s numbers and what his numbers were like with the other defencemen.

To get a sense of how each defencemen has done this season after 14 games and what their on-ice possession numbers have been like with the four lines, I pulled their on-ice Corsi For percentages with each of the regular centermen, using these forwards as a proxy for the lines. The most common deployment has been McDavid, Draisaitl and Strome centering their own lines. And I picked Brodziak as a proxy for the fourth line as he really hasn’t spent much time with the other regular centers. I could have picked Khaira, but he’s played about 15 minutes with Strome this season.

Below are the results. I’ve highlighted the Corsi For percentages in green if it’s above 52.0% and highlighted them in red if it’s below 48.0%. Anything between 48.1% and 51.9% is in yellow. The Oilers team Corsi For percentage is currently 50.32% (14th in the league).

11-06-2018 4-17-09 PM

We’re obviously dealing with small sample sizes, so the idea here is to look at what has happened rather than predict what’s likely going to happen in the future. This isn’t a final word on what the Oilers should do. Rather it’s about highlighting these numbers and asking further questions around why they’re happening.

Focusing on McDavid’s numbers, we see that his on-ice Corsi For percentages are well above the team average of 50.32% except when he’s with Nurse or Russell. When McDavid has been on the ice with both of them, the team has scored only once and allowing none – an on-ice goals-for per hour rate (GF/60) of 0.94, well below the 3.0 mark that we would expect when McDavid is on the ice. What’s especially concerning is the drop in offence whenever McDavid is on the ice with Nurse. When McDavid is on the ice without Nurse, the team generates 66.6 shot attempts per hour (CF/60). That number plummets to 55.0 when Nurse steps on the ice with him. The team rate right now is 57.12 (14th in the league, right around league average).

The rate of unblocked shot attempts for (i.e., Fenwick, FF/60, a proxy for scoring chances) also takes a significant hit when Nurse is on the ice with McDavid. McDavid’s on ice rate goes from 58.4 unblocked shot attempts per hour without Nurse to 38.6 with Nurse. The team as a whole generates 44.54 unblocked shot attempts (12th in the league, right around league average). In my mind, at no point should McDavid have an on-ice rate of shots and scoring chances below the team’s average..

I don’t think Nurse has magically become a bad player. In 2017/18 he played most of his minutes with either Larsson or Russell. And with either partner, he didn’t drag down McDavid’s possession or offensive numbers this badly.

  • McDavid with Nurse-Larsson: 300 mins (5v5), 53.04% CF%, 62.77 CF/60, 50.38 FF/60
  • McDavid with Nurse-Russell: 147 mins (5v5), 49.69% CF%, 64.88 CF/60, 51.09 FF/60

I suspect that there’s something tactic-wise that the coaching staff is doing differently this season when Nurse is on the ice or they may have adjusted something about his game. Whatever the case may be – it’s impacting McDavid’s offensive output and should really be addressed. Especially if Nurse is going to continue leading the Oilers defencemen in ice time at even-strength.

Data: Natural Stat Trick

Thoughts on the Oilers: Recent progress, depth scoring and KlefboMVP

mico113-114-2018-012419-jpg

Plenty of optimism around the Oilers as they sit third in the Pacific, winning their last two games and going 7-2-1 in their last ten. Their most recent win featured their fourth line scoring twice and a good performance from backup goaltender Mikko Koskinen.

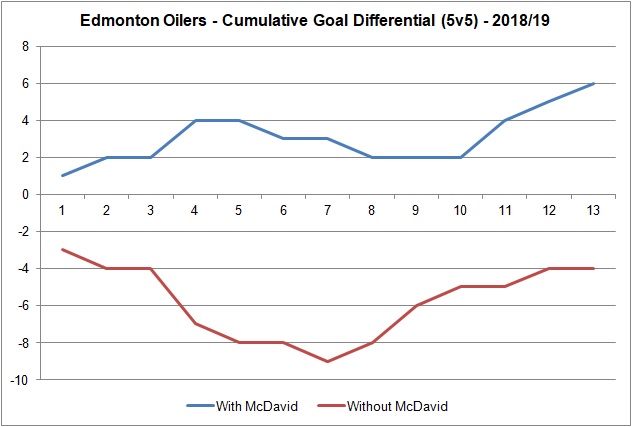
Those two features right there – depth scoring and goaltending – should get a lot of attention for the rest of the season. We’ve known for some time now about how the Oilers struggle to break even (goal-wise and shot-wise) when McDavid isn’t on the ice, and it needs to be better if this team intends on contending for a championship. And finding a reliable back-up – who could not only give Talbot a rest but also potentially push for the starting position next season – is going to be critical for long-term success.

The Oilers most recent stretch of games has seen their overall goal differential improve as they’re finally getting production from their depth forwards.

20181104 - Goal differential

Since their loss to Nashville on Hockey Night in Canada, the Oilers have played quite well – outscoring opponents 16-9 for a goal-share of 64.0% over seven games. I know I was pretty disappointed in that loss against Nashville; I felt like they had been getting lucky pushing teams like Winnipeg and Boston into overtime and looked so-so against the Predators. Plus I hate it when the Oilers lose on national games (even though I should be used to it by now). So it’s been a relief to see the team show some signs of life over the last couple of weeks.

As Darcy McLeod (@woodguy55) pointed out, the line of Draisaitl, Rieder and Chiasson has been outstanding. Over the last seven games, they’ve played just over 63 minutes together at even-strength (5v5), outscoring opponents 5-0. Their shot-share numbers have been solid as well, posting a 53.57% Corsi For percentage (proxy for possession) and a 56.57% Fenwick For percentage (proxy for scoring chances). This is a line that’s getting results and has the underlying numbers that indicate their success has a good chance of being sustainable.

The other trio that has shown some chemistry over a limited sample size at even-strength is Brodziak, Khaira and Kassian. Over the last seven games, they’ve played just over 42 minutes together, outscoring opponents 3-1 (75.0% goal-share). Their shot-share numbers together have been good as well – 59.77% Corsi For percentage and a 60.73% Fenwick For percentage. I’m not too surprised Khaira is having this success – he tends to do well when he can play center part-time with another center on his line. Kassian I feel like is the replaceable one here, and that if the team were able to move his contract and plug in someone like Cooper Marody, Khaira and Brodziak would still have success.

One thing I will add is that whoever the Oilers have on their third or fourth lines this season needs to be able to do some work on the penalty kill or powerplay. Right now the Oilers are running their top powerplay unit quite regularly with all five lefties (McDavid, Lucic, Draisaitl, Nugent-Hopkins and Klefbom) averaging over four minutes per game at 5v4. Finishing a season averaging over four minutes per game is almost unheard of for forwards, with only a handful of guys doing that over the last five seasons. On top of that, Nugent-Hopkins and now Draisaitl are getting regular minutes on the penalty kill – something I can’t see continuing. The coach is running his go-to players on the powerplay and may have an issue trusting others considering how much pressure he’s under to win this season.

One quick note about Nugent-Hopkins: he’s killing it on the penalty kill (4v5). He’s third on the team in total ice time shorthanded and has yet to be on the ice for a goal against. The rate of shots and scoring chances against are at their lowest this year when he’s on the ice – and he’s a big reason why the Oilers as a whole are doing better at limiting shots-against this season compared to last season. I have a couple theories as to why this is happening, but still working through some data.

One player that’s seeing significant minutes this season and doing quite well is Oscar Klefbom. He ranks fourth in the league in average ice time among defencemen, only behind Doughty, Suter and Karlsson. Over the first 13 games, the Oilers have a 68.75% goal-share (11 GF, 5 GA), and a 55.11% Corsi-for percentage with him on the ice – both metrics rank Klefbom first on the Oilers among defencemen. The possession numbers are what surprises me most as he’s often out there against the best opponents and starts most often outside the offensive zone compared to his teammates. It’s usually a team’s third pairing defenceman that often leads a team in Corsi-for perecentage and other shot-share metrics as they tend to get easier opposition and start often in the offensive zone.

Worth noting too that Klefbom has not been riding McDavid’s coat-tails. Some quick stats from the first 13 games:

  • McDavid with Klefbom (111 mins) – 55.08% CF%, 75.0% GF% (6 GF, 2 GA)
  • McDavid without Klefbom (101 mins) – 45.94% CF%, 66.67% GF% (4 GF, 2 GA)
  • Klefbom without McDavid (129 mins) – 55.17% CF%, 62.50% GF% (5 GF, 3 GA)
  • Oilers without Klefbom or McDavid (271 mins) – 46.40% CF%, 35.0% (7 GF, 13 GA)

That second bullet of the team posting a 45.94% Corsi-for percentage with McDavid but without Klefbom is interesting. We know McDavid has superhuman talent, so the concern here should be that someone is dragging down McDavid or is not playing the complementary role very well. My first thought is it’s Nurse’s play impacting McDavid, as I don’t think he’s been very consistent, especially in his own zone. He has posted a 45.95% Corsi-for percentage this season, which is just ahead of Rusell as well as Benning who only  up until recently been playing better. But it’s something to watch for on the Oilers blueline and its depth as I don’t think it’d be smart to overplay Klefbom.

Data: Natural Stat Trick, NHL.com