After posting some very dreadful penalty kill numbers in 2017/18, it was pretty much guaranteed that the Edmonton Oilers were going to make some changes to the coaching staff. The club managed to make some tactical adjustments late in the season to improve their penalty kill but it was too late. They had allowed the fifth highest rate of goals against per hour, thanks in large part to the high number of quality chances they were regularly allowing.
Related: The Oilers penalty kill was finally addressed – The SuperFan (2018, April 2)
I mentioned this in the article posted above, but had the Oilers paid any attention to some of their underlying penalty kill numbers in previous seasons, they may have looked for a way to get Talbot more rest, and more importantly adjusted their tactics to cut down the rate of shots and scoring chances against.
Instead the Oilers continued to rely on goal-data, a poor predictor of future success and one that doesn’t give you an accurate assessment of whether the results are sustainable or not. That’s where we use shot metrics, which gives us a better sense of if the process and tactics a coaching staff implements are working.
What’s troubling is that to find a suitable replacement for Jim Johnson to run the penalty kill next season, it appears the Oilers may have been looking at goal-data again.
Now Trent Yawney, in my opinion, was targeted and hired by the Oilers for good reason. Along with having head coaching experience at the NHL and AHL level, and experience serving as an assistant to McLellan in San Jose, Yawney has had a lot of experience working with and developing the young defencemen in the Ducks system – many of which are turning into useful NHL players.
But what probably drew the Oilers attention the most about Yawney is his solid track record running the Ducks penalty kill. In short, it’s been outstanding based on the actual results (i.e., goals against). But digging into the Ducks underlying numbers, there may be some areas for concern.
Below are the Ducks numbers from the last four seasons, including the rate of goals against, the rate of expected goals against and the team save percentage. I’ve also included the Ducks league ranking in parentheses (Source: Corsica Hockey)
| Season | GA/60 | xGA/60 | Save% |
| 2014/15 | 5.45 (3rd) | 6.61 (19th) | 88.92 (3rd) |
| 2015/16 | 4.15 (1st) | 5.79 (10th) | 91.27 (1st) |
| 2016/17 | 4.86 (2nd) | 7.44 (28th) | 90.80 (1st) |
| 2017/18 | 5.48 (4th) | 7.23 (18th) | 90.35 (3rd) |
Couple quick notes:
- I regularly use the rate of goals against per hour (GA/60) rather than the standard penalty kill efficiency percentage to measure a teams success. I think it’s important to factor in the amount of time a team is killing penalties to know how truly efficient they are. Quite often, how a team ranks in terms of GA/60 is close to their penalty kill efficiency, but I think GA/60 is a more accurate measurement.
- I’m using the rate of expected goals (xGA/60) which is a weighting placed on every unblocked shot based on the probability of the shot becoming a goal. This depends on the type of shot, location and uses historical shot and goals data to come up with the probability for each unblocked shot. This has been found to be a better predictor of future goals than Corsi and Fenwick. (Detailed explanation can be found at Corsica Hockey)
- Comparing the actual rate of goals against with the expected rate of goals against also makes it easier to compare and interpret the two metrics. Rather than comparing say, the penalty kill efficiency as a percentage to the rate of shots or scoring chances against.
So what we see in the table above is that in the four seasons with Yawney running the penalty kill, the Ducks were outstanding ranking in the top five across the league when it came to the rate of goals against per hour.
However, the team was not so good limiting scoring chances, often ranking below average, and it’s reflected in the rate of expected goals against (xGA/60). The last two seasons had been especially bad. Based on the high quality chances they were allowing on the penalty kill, the Ducks number of expected goals against (based on historical probability) was 54 in 2017/18 and 58 the season prior – the highest numbers in the league. Instead, their penalty kill only allowed 41 goals in 2017/18 and 38 goals in 2016/17 – some of the lowest numbers in the league and well below the number of expected goals.
You can also see how bad things were on the Ducks penalty kill over the last two seasons using the shot location maps from HockeyViz. Notice the dark purple in front of the Ducks goal, which indicates that they were well above the league average.
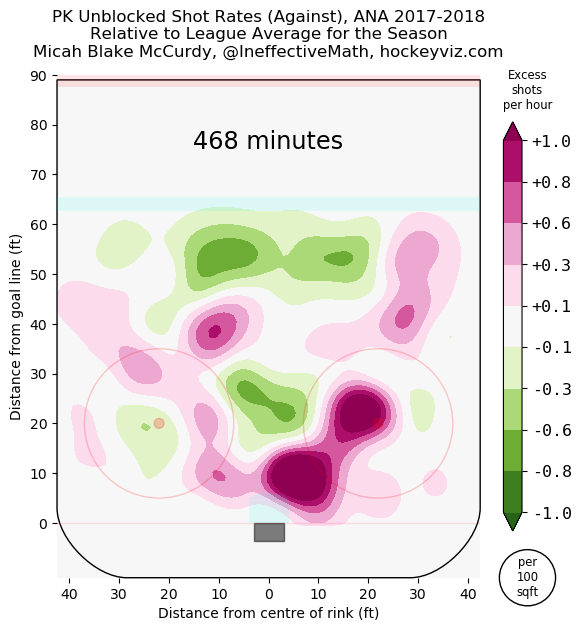

Now compare those two maps above with the map from 2015/16 when the Ducks had one of the better rates of expected goals against on the penalty kill. You’ll notice a lot less purple around the goal.

I’d be curious to know what the Ducks did differently in 2015/16 when they not only got great results (lowest rate of goals against per hour), but they also did really well limiting shots and chances as reflected by the expected goals metric. I’d rather apply the tactics (and possibly player deployment) that Yawney used in 2015/16 than the ones that were in place in 2016/17 and 2017/18.
My main takeaway from the numbers and the maps is that the Ducks have been pretty blessed with some outstanding goaltending on the penalty kill over the last few seasons. More specifically, it’s been the play of netminder John Gibson that’s really driven the Ducks success.
A quick glance at the 63 goalies who have played at least 250 minutes at 4v5 over the last four seasons, and John Gibson ranks near the top across a number of metrics. This includes the best save percentage, the sixth best high-danger save percentage, and also number one when it comes to goals saved above average (GSAA), the background of which you can find here.
So while it’s easy to give the coach credit for the success a team has had on the penalty kill, it’s worth splitting out the areas where the coach has actual control over the outputs. In this case, Yawney’s performance should be evaluated using the shot metrics to know if his group is actually good at keeping shots outside and out of danger areas. From the looks of it, the tactics he’s used over the last two seasons on the penalty kill haven’t been working, and he regularly relied on Gibson to bail the team out. Unfortunately, Yawney won’t have that luxury in Edmonton, as Talbot’s penalty kill numbers, while respectable, aren’t close to Gibson’s.
Data: Corsica Hockey, HockeyViz

Pingback: Looking to Winnipeg for inspiration | The SuperFan
Pingback: Hitchcock’s history with special teams | The SuperFan
Pingback: Powerplay expectations | The SuperFan
Pingback: Tracking the Pacific division – As of December 23, 2021 | The SuperFan