Joined by Kevin Papetti from Maple Leafs Hotstove to get some insight on the Toronto Maple Leafs, the changes they’ve made this off-season and what their strengths and weaknesses are. We talked about how the Leafs could deploy their forwards and defence pairings to handle the skilled players of the North division. Kevin also shared his thoughts on defenceman Tyson Barrie, what led to his departure from Toronto and where he could fit in on the Oilers blueline.
With Riley Sheahan signing a professional tryout agreement with the Buffalo Sabres, the Edmonton Oilers will need to find another forward or two to add to their penalty kill rotation this coming season.
Sheahan lead the Oilers forwards in shorthanded ice time last season, playing 155 minutes and averaging 2:21 minutes per game. Leaguewide, he was in the top 25 among all forwards in ice-time, which wasn’t out of the ordinary for him as he’d often been relied on as one the top penalty killers for his previous clubs. The Oilers, as we know, finished the 2019/20 regular season with the second best rate of goals against on the penalty kill with 5.15 per hour, due in large part to their goaltending. While the Oilers allowed the ninth highest rate of shots against, the team save percentage was the best in the league with 90.61% – well above league average levels.
When asked about the penalty kill and adjusting to life without Sheahan on the roster, head coach Dave Tippett had this to say on The Jason Gregor Show on Wednesday:
We’ve added some extra depth. I think you’ll see Turris come in and penalty kill. Haas really came on in the second half of the year. I think he could get some of that. We’ve got Josh Archibald here still. I like the structure…[Oilers associate coach] Jim Playfair does a nice job with our players.
Having the right handed centerman…instead we had Riley [Sheahan] who was a left hander. We got JJ Khaira too that can take face offs there. Having the right hander I think will help us. The one thing in the NHL, the team that goes on the powerplay gets to pick the side of the faceoff they’re going on. Majority of teams pick what would be our right corner, their left corner. So having a right handed faceoff guy there to start with puck as many times as you can will be a benefit for us.
I think Turris will do a good job for us. I had him in the same role at World Championships about five years ago. He was a good penalty killer for us there. He hasn’t done much the last couple years but we’re going to push him into that role a little more, so I think our penalty kill will be fine. Source: The Jason Gregor Show (2020, December 30)
I always appreciate it when coaches like Tippett take the time to share their knowledge and go a little deeper into their thought process. It doesn’t have to be detailed or too technical, but just enough insight that, when well communicated, can go a long way in educating fans and helping grow the game.
Couple things stood out for me in Tippett’s comments. First, Tippett has zeroed in on defensive zone faceoffs and improving in that area to get positive results on the penalty kill. Last season, the Oilers ranked 25th in the league when it came to defensive zone faceoffs when shorthanded with 41.8%. The league average was 44.6%, with Philadelphia and Vancouver being the only two teams above 50%. The Oilers relied solely on their left-handed centermen – Sheahan, Nugent-Hopkins and Draisaitl – to take defensive zone draws, with Draisaitl posting the best rate among the three with 48.8%. Sheahan finished with 40.7% and Nugent-Hopkins finished with 36.7%. Now with Turris slated to be a centerman in a bottom six that Tippett likes to rely on for penalty kill duties, he’ll be a prime candidate to take on at least some of those minutes left vacated by Sheahan.
I’m just not sure that Turris can be a guy that could have a positive impact on the penalty kill.
For one, he’s barely played on the penalty kill in recent years. In 62 games with Nashville last season, Turris played just over 40 minutes shorthanded and averaging 39 seconds per game, which had him seventh on the team among forwards. This appears to have been a way for the coaching staff to get Turris more ice time as he had gradually been falling further down the depth chart. In the two seasons prior with Nashville, he wasn’t a regular option at all on the penalty kill, spending more time in the top six and on the powerplay units.
The last time Turris was a regular option on the penalty kill was in his first two seasons in Ottawa between 2013 and 2014. He was third in total ice time among Senator forwards in the lockout-shortened season, averaging 1:25 per game, and played 142 minutes in 82 games the following season (2013/14), averaging 1:44 per game – good for third among all forwards on the team. The Senators penalty kill ranked 22nd in the league that season allowing 7.03 goals per hour, and 19th when it came to the rate of shots against.
Turris saw his penalty kill ice time drop down to 60 minutes in 82 games the following season in 2014/15, ranking seventh among forwards in average ice time per game with 0:44, and then drop even further in 2015/16 when he averaged only 0:19 per game. In 2016/17, and near the end of his tenure with the Senators, Turris did see an uptick in his penalty kill ice time over 78 games where he played about 43 seconds per game, ranking seventh among forwards.
What stands out in Turris’ penalty kill numbers are the rates of shots against when he’s been on the ice. In 2013/14 when Turris was third on his team among forwards in average ice time per game, the Senators allowed 12 more shots against per hour with him on the ice. Similar issue occurred the year before as the Senators allowed an extra 14 shots against per hour with Turris on the ice. Considering that on average teams allow about 54 shots against per hour, that’s about a 22% increase in shots against with Turris deployed. This might be why Ottawa’s coaching staff gradually reduced his ice time on the penalty kill and why Nashville didn’t give him any ice time shorthanded in his first two seasons as a Predator. And when Nashville did give him some reps on the penalty kill last season – perhaps to increase his trade value – they allowed an extra 12 shots against per hour with Turris on the ice. This translated to about a 24% increase in shots against per hour with Turris on the ice, which is consistent with his career averages on the penalty kill.
Where Turris might be able to help on the penalty kill is with defensive zone draws. He was poor last season in limited minutes with Nashville, only winning four of twelve draws. But over his career on the penalty kill, Turris has a 50.5% face off percentage in the defensive zone with his best season coming in Ottawa in 2013/14 when he won 55.8%. This might have been why Tippett had him on the penalty kill for Canada at the 2014 World Championships. Remember, the Oilers ranked near the bottom of the league in winning shorthanded defensive zone face offs last season with 41.8%, while the league average was 44.8%. There’s obviously more to defensive zone draws like what actually happens after a draw in terms of shots and goals against, and the team’s strategies to control the ice. But faceoff win percentage appears to have been one of the factors in the Oilers decision to sign Turris.
Perhaps Tippett is envisioning Turris’ role as what Tyler Dellow would refer to as a FOGO guy – face off, get off. This would mean someone like Gaetan Haas, who Tippett mentioned as a legitimate option, sees more playing time on the penalty kill as a right handed centerman to replace Turris after a draw. Haas was not a regular penalty kill option for the coaching staff last season, only playing a total of six minutes, and was poor when it came to face-offs winning only 42% in all situations. So it might be his defensive play at even-strength that has him in the discussion for shorthanded ice time. While offence pretty much died when he or any of the bottom six forwards were on the ice last season, Haas’ on-ice defensive numbers were strong. The Oilers allowed their lowest rate of shots against among regular forwards with Haas on the ice, perhaps making him an ideal candidate to see more time on the penalty kill.
It’ll be interesting to see how things play out this coming season and how exactly Turris will be deployed on the penalty and if he can have a positive impact. If Turris can flourish there as a FOGO guy in a tandem with someone like Haas, great. It could free-up the skilled forwards like Draisaitl and maybe even Nugent-Hopkins to spend more time and energy at even-strength. If not, the coaching staff will have to make adjustments on the fly and figure things out to remain competitive in their division.
We discussed the Oilers off-season activities, what our expectations were following their loss to Chicago in the play-in round and managements approach to re-tooling the roster. We gave our thoughts on which players will have the biggest impact the upcoming season, and how the roster might shake out including the reserve/taxi squad – check out Ira’s recent article at The Copper & Blue. We also touched on the All-Canadian division and where we see the Oilers finishing.
The defenceman is rumored to be on the Oilers radar. What would the Oilers expect from him, considering their needs at even-strength and the penalty kill.
It’s probably a spot of bother for the Edmonton Oilers that they’ll be starting the 2021 condensed regular season without defenceman Oscar Klefbom.
When he’s healthy, he’s been one of their top performers on the blue line often earning the trust and praise of his coaches. Last season he lead the team in average minutes played per game, with over 25, regularly facing top competition every night. He was a key part of the powerplay and penalty kill, leading all defencemen in total ice time for both situations.
“Ultimately, you look at your bench and you look at players you can put into a situation where they can help you win the most,” Tippett explained earlier in the season. “When he’s on the ice that much, he must be doing some good things.
And it’s probably what Oilers management thinks of him as well considering how often the Oilers come up in recent free agent rumors surrounding the available defenceman.
The Edmonton Oilers are exploring several options for a left shot defenceman. One of those options: UFA Ben Hutton. I'm told there is serious interest, but there are multiple teams in the mix.
Unless the Oilers are willing to move assets, the Oilers probably won’t be able to replace Klefbom and what he typically brings to the team with one of the available free agents. What they can try to do however is address each area of the team that he impacts the most and find suitable replacements for those.
For example, his puck distribution and offensive skill will definitely be missed on the powerplay unit that dominated the league last season. But the Oilers have added 29-year old Tyson Barrie, who has over 500 games of experience and was a key part of the Leafs powerplay, which finished the 2019/20 season with the sixth highest rate of goals per hour. There will need to be some adjustments considering Barrie is a right-shot defenceman, but you can see the Oilers mitigation strategy.
It still, however, remains to be seen how exactly Klefbom’s even-strength (5v5) and penalty kill time is going to be replaced. The Oilers may have some confidence in someone like Caleb Jones or William Lagesson, both of which have spent time developing within a good development program in Bakersfield, to take on those minutes. Jones in particular has been given opportunities in Edmonton, having now played 60 NHL games and was averaging more ice time than veteran Kris Russell at the end of the 2019/20 regular season.
Whatever internal options the coaching staff has confidence in, it’s imperative that the Oilers add a defenceman with even-strength and penalty killing experience. And Ben Hutton, who the Oilers are rumored to be in on, makes some sense especially if the cost and term is kept minimal.
Hutton was drafted in the fifth round of the 2012 draft and made the Canucks opening night roster in 2015 following three seasons at the University of Maine. In his rookie season as a 23-year old, and because of the injury issues on the Caucks blueline, he finished second on the team among defenceman in total ice-time and had the most points among defenceman with 25. He was largely sheltered in those minutes, averaging the fifth highest minutes per game, leaving the likes of Edler, Hamhuis and Tanev to play against more of the top line competition. Hutton did also lead the Canucks defencemen in powerplay ice time, but his on-ice results were poor. The Canucks as a team finished 28th in the league in points percentage that season, only ahead of Edmonton and Toronto, with the powerplay finishing 27th overall scoring only 5.53 goals per hour.
Hutton went on to play three more seasons in Vancouver, with the team missing the playoffs all three seasons, before signing with Los Angeles when the Canucks did not make him a qualifying offer as a restricted free agent. Over the course of his four-year career with Vancouver, Hutton saw his total ice time increase to over 22 minutes per game, getting more responsibility at even-strength, while his deployment on special teams shifted – more on that later.
Season
Team
GP
Total TOI/GP
5v5 TOI/GP
PP TOI/GP
PK TOI/GP
2015/16
VAN
75
19.87
15.67
2.37
0.92
2016/17
VAN
71
20.50
17.14
2.06
0.54
2017/18
VAN
61
18.41
15.30
1.01
1.62
2018/19
VAN
69
22.36
17.37
1.87
2.33
2019/20
L.A
65
18.26
16.31
0.15
1.39
In his first three seasons with Vancouver, Hutton was often fifth or sixth among defencemen when it came to the total proportion of ice time playing against top line, or elite, competition according to Puck IQ. Because of the injuries to the Canucks blueline, Hutton played over 34% of his total ice time against elite competition. But for the next two seasons (2016/17 and 2017/18), that proportion of ice time was below 30% – probably right where he should be based on his skill set. He did well in those minutes, posting decent shot-share numbers relative to his teammates.
Establishing some simple targets for the Edmonton Oilers if they want to be considered a top end team.
It’s going to be a unique situation with the season kicking off on January 13th with 56 intra-division regular season games spanning over 16 weeks. Coaching staffs are going to have to be creative with practice schedules, recovery time and roster management as there won’t be much time between games. And training camp starts in less than two weeks. Wild.
Now the main goal for the Oilers is to finish in the top four of their division and secure a playoff spot. That means they should be targeting a 0.600 points percentage – the total points accumulated divided by the points that were available, including extra time. This is what the top ten regular season teams in the league typically reach every year and are often considered as legitimate contenders. The Oilers were close to this level last season, finishing with a 0.585 points percentage, good for 12th in the league. The one time they made the playoffs in the last 14 seasons they had finished the regular season with a 0.628 points percentage.
With a 0.600 points percentage goal in mind, we can start to identify some key performance indicators (KPI’s) that we can measure the Oilers against. This would include not only the actual results like goals for and against, which of course determines how many points a team has in the standings. But also shot-based metrics, which can measure how well a team is doing at out-shooting and out-chancing opponents. Controlling the flow of play and spending time in the offensive zone is what teams are trying to do and what leads to better results, so we can use the publicly available shots data as a proxy. It’s important to monitor this info as part of the overall evaluation of a club as it can tell us if the actual results (i.e., goals for and against, and accumulated point totals) are sustainable or not.
Below are the KPI’s I’ll be using for even-strength play (5v5), with a brief description for each.
Goals For percentage (GF%) – The proportion of all the goals that the team scored and allowed that the team generated (i.e., Goals For/(Goals For + Goals Against).
Shooting percentage (SH%) – The percentage of the team’s shots on goal that became goals.
Save percentage (SV%) – The percentage of the team’s shots on goal against that were saved.
Corsi For percentage (CF%) – The proportion of all the shot attempts the team generated and allowed that the team generated. This is used as a proxy for possession and can predict a team’s future share of goals (GF%).
Expected Goals For percentage (xGF%): Measures the quality of the unblocked shots taken, and assigns a value to it depending on the probability of it becoming a goal. Key variables include the type of shot taken, where it was taken from and compares it to historical shot and goal data to determine the value. (Natural Stat Trick)
Now it’s a pretty straight-forward exercise to set the actual values for the identified KPI’s. What I did was look at the last three regular seasons, zeroed in on the teams who finished their seasons with a points percentage above 0.600 and then calculated the group’s averages for each metric. For context and to measure how well the Oilers are doing relative to past teams, I also calculated the league average rate for each metric as well as the average rate for teams that finished in the bottom third of the league.
Let’s start with goal-scoring rates for and against, and the overall goal-share.
Metric
Top Teams
League Average
Bottom Teams
Goals For/60
2.67
2.45
2.27
Goals Against/60
2.31
2.45
2.59
Goals For%
53.58
50.01
46.72
At minimum, the Oilers cannot be getting outscored at even-strength and posting a goal-share of less than 50% – that much should be obvious. But we get a much more specific goal-share that the Oilers should be targeting based on what top level teams have posted in the past. The Oilers should be targeting a rate of 2.67 goals per 60 to be in that upper end category, and at minimum allowing less than 2.45 goals against per 60.
This of course is going to be determined by player-driven-outcomes – how well players are finishing their scoring opportunities and how well the goaltending holds up. Top teams on average post a shooting percentage of 8.46% at even-strength and a save percentage of 92.28%. Note that the difference between top teams and bottom teams when it comes to these player-driven-outcomes are pretty razor thin.
Metric
Top Teams
League Average
Bottom Teams
Shooting%
8.46
7.99
7.60
Save%
92.28
92.02
91.90
The question worth asking at this point is can the Oilers reach the goal-share level of a top team this upcoming season. They finished the 2019/20 regular season with a goal-share of 47.32%, ranking 25th in the league only ahead of the California teams, Ottawa, New Jersey and Detroit. The good news is that they were trending upwards to finish the season, posting a goal-share of 50.93% over their final twenty-five games.
Now finishing chances didn’t appear to the be the issue last season, as the Oilers posted a shooting percentage of 8.43%, which is closer to what top end teams post. The problem was that they didn’t generate enough chances, ranking 27th in the league with 52.64 shot attempts per hour, and ranking 21st in the league with 2.24 expected goals per hour.
The other major issue was the goaltending at even-strength, which ranked 25th in the league last season at 91.23%. It did gradually improve over the course of the season, but it cost them games and points in the standings especially early on in the season. The Oilers knew about this issue, and while they did pursue some of the higher end goalies in the off-season, the best they could do was bring back Mike Smith – one of the worst goalies in the league last season. In a shortened season with less time to make up ground, goaltending has to be, at minimum, league average.
Considering that goaltending might be a weak spot, the Oilers will need to figure out how to control the flow of play as measured by Corsi For% and spend more of their time in the offensive zone. Similar to above, I’ve calculated the averages that top teams have posted, along with the averages for bottom teams and league-average teams for context. I’ve also added the targets when it comes to expected goals, which measure the quality of the shots taken, and assigns a value to it depending on the probability of it becoming a goal.
Metric
Top Teams
League Average
Bottom Teams
Corsi For/60
58.41
56.37
54.68
Corsi Against/60
54.29
56.37
58.50
Corsi For%
51.84
49.99
48.29
Metric
Top Teams
League Average
Bottom Teams
Expected Goals For/60
2.37
2.29
2.19
Expected Goals Against/60
2.21
2.29
2.39
Expected Goals For%
51.72
50.01
47.86
Reaching the Corsi and Expected Goal levels posted by previous top-level teams will help to off-set the Oilers weakness in net and potentially increase their chances of winning games. It’ll definitely be a challenge for the coaching staff as they have the high end talent that needs to take some risks to create scoring chances, but there’s not enough defensive skill on the roster that the coaches can spread across the lineup.
Lots to track this upcoming season and plenty more analysis to be done within each metric. For instance we may find that the Oilers team performance may be impacted by specific parts of the roster like the bottom six forwards or maybe a defence pairing that’s in over its head. Whatever the case may be, the Oilers have to be monitoring basic indicators like this and hopefully more. During the course of the season, the coaching staff and management should be mindful of whether the results, whether it positive or negative, are real and sustainable. And management needs to make changes to the roster as needed, with an eye on the long-term goal of contending for championships.
I joined Ken Dawson on CBC Radio Active on Tuesday to talk Oilers and the upcoming season that’s scheduled to begin on January 13th. Full segment is here: CBC Radio Active (2020, December 22)
Topics we covered:
How the North, All-Canadian division might shake out, and the Oilers chances of making the playoffs.
The Oilers off-season activities, and if it’s enough to make the team competitive.
Areas of concern, specifically goaltending and the defence group.
Thanks to the team at CBC for putting it all together!
I joined Adrienne Pan and Rod Kurtz on CBC Radio Active on Friday to recap free agency day, and the Oilers offseason activities. Full segment is here: CBC Radio Active (2020, October 9).
Topics we covered:
What to expect from Kyle Turris as a depth centerman.
Goaltending options, and how best to address their situation.
The signing of Jesse Puljujärvi, and how to get the best production from him.
The Oilers performance at the draft, and what to expect from first round pick Dylan Holloway.
Big thank you to everyone at CBC for putting it all together!
Something that I’ve been curious about since the Edmonton Oilers were eliminated in the qualifying round of the playoffs was how their 2019/20 regular season compared with top-end teams.
No doubt the Oilers were a good team this past season, finishing second in the Pacific division collecting 83 points in 71 games – a respectable 0.585 points percentage. But while they were close, it didn’t put them in that 100-point zone where teams that finish with at least a 0.600 points percentage in a normal 82-game season would land. That’s the level they need to be at consistently, especially with two superstars signed to long-term deals.
The question then is how close were the Oilers to posting numbers similar to teams that have been in the 0.600 point club? When it comes to even-strength, goal-scoring, goaltending – did the team, at any point, post numbers closer to that upper category or were they closer to league average levels?
To figure this out, I first looked at how every team did in their last five regular seasons prior to the 2019/20 season – 2014/15 to 2018/19. That gives us a total of 152 teams, 57 of which finished their regular seasons with a points percentage of 0.600 or more. These are the teams that typically finish at or near the top of their division with 100+ points, and get considered as cup contenders heading into the playoffs. Washington, St. Louis, Pittsburgh, Tampa Bay – they show up at least three times in that five year period. Edmonton shows up once – 2016/17 when they finished with 103 points – and we know how much hype and attention was given to them for those results.
Based on those 57 teams, I wanted to know on average what their goal-share and various shot shares were like like at even-strength and special teams, and if the Oilers ever put together a stretch in their 2019/20 regular season that was around those levels. For comparison, I also wanted to know what the league average numbers were for each metric, and also what the numbers were like for the bottom 50 teams. As you may have guessed, the Oilers show up four times in that group.
Here are the results at even-strength (5v5).
Group
PTS%
GF%
CF%
xGF%
Sh%
Sv%
Top teams
0.641
53.73
51.64
51.98
8.18
92.52
League average
0.558
49.99
49.99
49.99
7.76
92.24
Bottom teams
0.453
45.45
47.68
47.32
7.36
91.92
On average, the top teams, the ones that finished their regular season with a points percentage of 0.600 or more, posted a goal-share above 53% at even-strength, often controlling the flow of play, as measured by Corsi For% and generating a higher share of scoring chances, as measured by the Expected Goals For% metric. That really shouldn’t come as a surprise. Teams that get good results and compete for championships are the ones that consistently out-shoot and out-chance opponents.
Quick side note. What I found interesting was how close the more player-driven outcomes, like shooting percentage and save percentage were between the three categories. The margin of error is razor thin in the NHL, with top teams getting on average a team save percentage of 92.52%, while the bottom teams had an average save percentage only 0.60 points below that. Similar case when it comes to shooting percentage. Good teams convert on average 8.18% of their shots into goals, while bottom teams are only 0.82 points below that. It should be obvious to general managers that they have to load their roster with as much talent as possible, and deploy players that drive results in some positive way. Easier said than done of course, but there really can’t be any wastage – optimize that roster and continuously look to improve at every position, no matter how incremental the improvement.
So how did the 2019/20 Oilers compare?
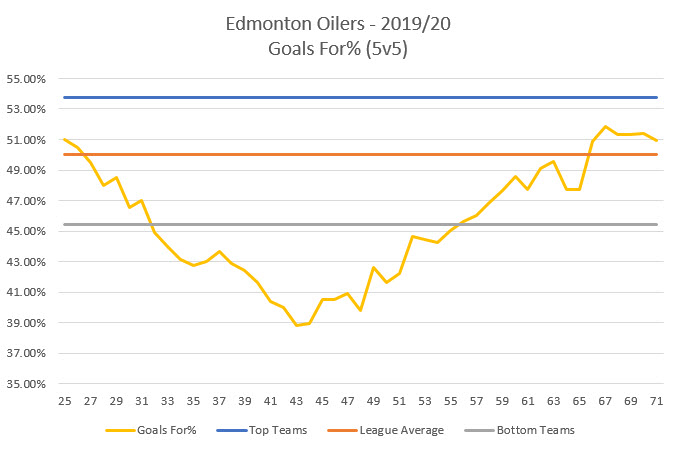
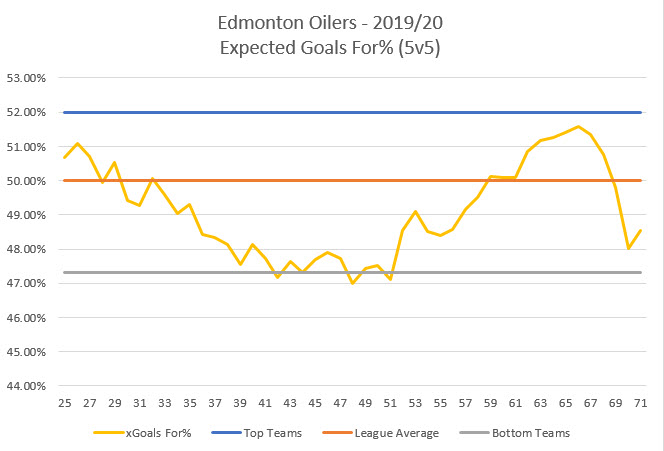
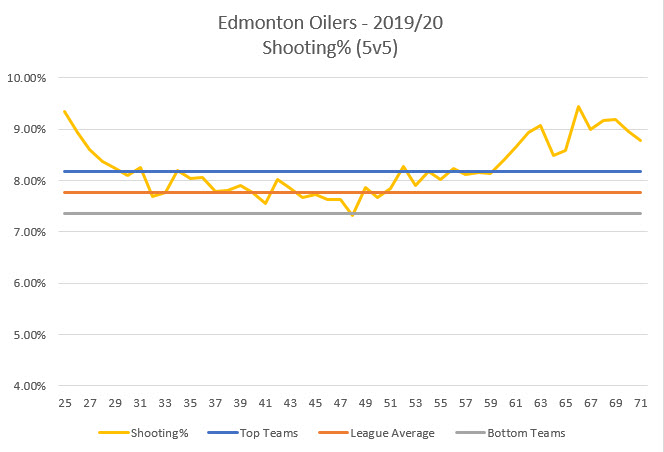
What I’ve done for each metric is graph the Oilers 2019/20 numbers over rolling 25-game segments, and included lines to show the level that a good team, an average team and a poor team is at.
Lets start with the most important one: goal-share at even-strength. We know the Oilers struggled here, finishing the season with a -16 goal differential at even-strength, a goals-for percentage of 47.32% (25th in the league) only ahead of the California teams, Ottawa, New Jersey and Detroit.
Ghastly results with the team at one point posting a goal-share of less than 40%. But the good news is that the Oilers finished the season well, posting a goal-share of around 51.0% over their final 25 games. Not bad, but as we see in the graph, that’s only slightly above the league average level of 49.99% (orange line) and still below what 100-point teams have posted (blue line). Note that we’ll see what really drove the poor goal-share in a bit.
How about the even-strength shot-share metrics? Below are the 2019/20 Oilers rolling Corsi For% and Expected Goals For% – again with the average levels that a good team (blue line), an average team (orange line) and a poor team (grey line) have posted.
The Oilers finished the 2019/20 regular season 24th in the league when it came to Corsi For% with 48.19% and 22nd in Expected Goals For% with 48.85%. And while they did get back to league average levels near the end of the season, for the most part they hovered closer to what poor teams have posted in the five seasons prior. I know a lot was made about the Oilers performance after the Christmas break and how things turned around, but it still wasn’t good enough. That has to be addressed by both the manager building the roster and the coach that’s charged with tactics and deployment.
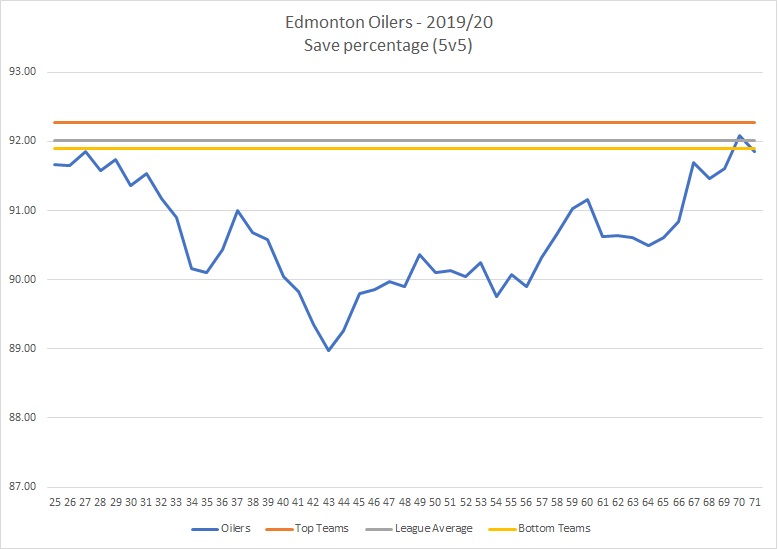
Finally, here’s how the Oilers did when it came to the player-driven outcomes: shooting percentage and save percentage.
Lets start with the good news. In 2019/20, the Oilers posted a team shooting percentage of 8.43%, which is slightly above the league average. What’s especially encouraging is that at various points of the season, the team’s shooting percentage was close to the scoring rates posted by top teams. The key for the Oilers is to find more scoring talent to surround the superstars with, and really maximize the offence (i.e., shots, scoring chances) that they consistently generate.
On the flip side, the Oilers goaltending was one of the worst in the league in 2019/20 and was well below what even the poorest teams have posted in past regular seasons. Look at the yellow line one more time. That has to be a spot of bother for management, knowing that their decision-making last summer to address the goaltending cost them wins and points in the standings. They need to get it right this summer.
Based on the performances we’ve seen from the top contending teams, there are very clear, tangible targets for the Oilers to work towards. An even-strength goal-share of 52.0%, supported by shot-share metrics above 51.0% is a reasonable goal. And getting league average team shooting and save percentage will take them a long way.
Hopefully the Oilers management is aware of their team’s deficiencies and making decisions this off-season that are geared towards winning games and becoming legitimate contenders. A 100-point regular season, or a points percentage of 0.600 or more, remains the goal and will give us an indication if a championship is in the cards.
Points-percentage (Point%) – The total points accumulated divided by the points that were available, including extra time.
Goals For percentage (GF%) – The proportion of all the goals that the team scored and allowed that the team generated (i.e., Goals For/(Goals For + Goals Against).
Corsi For percentage (CF%) – The proportion of all the shot attempts the team generated and allowed that the team generated (i.e., Corsi For/(Corsi For + Corsi Against). This is used as a proxy for possession and can predict a team’s future share of goals (GF%).
Expected goals: Measures the quality of the unblocked shots taken, and assigns a value to it depending on the probability of it becoming a goal. Key variables include the type of shot taken, where it was taken from and compares it to historical shot and goal data to determine the value. (Natural Stat Trick)
Shooting percentage (SH%) – The percentage of the team’s shots on goal that became goals (i.e., total goals divided by the total shots on goal).
Save percentage (SV%) – The percentage of the team’s shots on goal against that were saved (i.e., 1-(totals goals allowed divided by the total shots on goal against))
Took part in a Q&A/roundtable over at The Copper & Blue. Below were my responses.
The Oilers exited the play-in round a little more than a month ago, and it’s given us time to think a bit about the year. How do you feel about how the season went? Are you satisfied?
Even though they missed the playoffs, it’s hard to complain too much considering they posted a 0.585 points percentage in the regular season, finishing second in the Pacific and 12th in the league. The team was competitive most nights, special teams were outstanding, their top players did well and we saw a cluster of players transition from the minors and take on important roles. But the Oilers definitely over achieved, and Coach Tippett recognized that at his end-of-season availability. They were badly outscored at even-strength (5v5) relying heavily on their powerplay, posted mediocre shot-share numbers and their goaltending was sub-standard. Aside from their superstar players and the hope that more players will graduate from the AHL, there aren’t many indications that this team is going to be competing for a championship anytime soon. Over the course of the regular season, the team did very little to better position their roster construction going forward. They added a few bad contracts to their books, including signing Kassian to a long-term deal, and sent away much needed draft picks.
So while the results were good, management’s off-ice decision-making has been very concerning.
Who is this team’s top line right winger at the beginning of next season, and why?
Based on how much ice-time he received from the coaching staff at even-strength in the regular season and the contract that management gave him, it’s probably Kassian. He was fourth on the team among forward in total ice time and average ice time per game, even ahead of Nugent-Hopkins, and was McDavid’s most common linemate. Two things the Oilers need to do here: (1) find a better option for McDavid by either adding depth – this should not cost a lot, and (2) come to the realization that you do not pay a premium for players who do well with McDavid. The Oilers can’t be content with their current situation at right-wing.
Mikko Koskinen is signed for another two years in Edmonton, while Mike Smith is an unrestricted free agent. What should Ken Holland do between the pipes for the Oilers heading into next season?
First, review the process and methodology or whatever that led the Oilers to sign Smith to a contract last summer and fire it into the sun. Retain Koskinen since he’s provided league-average goaltending and expect him to start half of the games next season. His contract is a little high for the amount of workload expected, which makes it even more critical that they not overspend on the second goalie. Who they find as a second goalie doesn’t matter as long as they’ve posted league average numbers over the last few seasons and the acquisition cost is low. The only way the Oilers can acquire a higher-profile goalie like Holtby, or Lehner or Murray is if they’re planning on moving Koskinen – which I don’t suspect there’s much of a market for considering it’s a buyer’s market this off-season. I do like the idea of acquiring a younger goalie who has shown well recently like Alexander Georgiev, but that would require taking on some risk which I don’t think management is comfortable with. Also – look at goaltender coaching/consulting options and pray that one of the goalie prospects in the system continues to develop.
What do the Oilers do with Ethan Bear’s next contract?
The same thing that the Oilers did with Klefbom when they recognized his abilities early and wanted to see his best years happen in Edmonton. A long-term deal for Bear is ideal to potentially reduce the annual average value, knowing full well that he could be overpaid in the early years, but holding a value contract over the majority of its term. Financial risk is spread between the team and a player that it drafted and developed and deployed, and it’s how things have to be done in a salary cap world.
Is there any scenario where the Oilers can win a deal by moving Oscar Klefbom?
Definitely, as long as the manager isn’t basing his decisions on the NHL Guide and Record Book. The player coming back would just have to be young, on a long-term team-friendly deal and can contribute on the powerplay and penalty kill. Honestly, if the Oilers are so frisky to move a top-four defenceman, show some courage and start creating a market for Nurse whose perceived value is going to be much higher than his actual value.
We are a year away from the next expansion draft, but it’s never too soon to begin thinking about who could be selected. Who do you hope Seattle takes from the Oilers? Is there a player you believe the Oilers ought to keep, but is at risk being selected?
Ideally Seattle takes an older Oiler who’s on a bad contract and under producing, or whose actual contributions might be overhyped. Kassian and Neal come to mind, but it could be someone younger and further down the depth chart like Khaira. Knowing who Seattle has working in their hockey operations department, I suspect they’ll target young players who have shown well at the professional level and whose contracts are under team control.
Before they look for goaltending again, Oilers management needs to review their previous evaluation and decision-making methods.
One of the most important parts about decision-making, especially when you’re spending significant money or assets to achieve a specific goal, is the evaluation that follows it. It’s standard business practice in the corporate world when CEO’s work to maximize the value of an entity and try to find any sort edge over their competition. Scrutinizing internal processes, finding strengths and deficiencies and re-calibrating things is a critical component when building a sustainable product.
The same approach to evaluating decision-making has to apply in professional hockey. When every corner of the roster needs to be optimized for maximum value under a salary cap system, it’s critical that teams know if their roster decisions led to positive outcomes and, just as importantly, know if their methods behind the decision process was adequate and how it can be improved going forward. With a large pool of players and a limited number of roster spots, teams are faced with recurring decisions regarding their roster construction – so refining their decision-making methods has to be top of mind.
The Edmonton Oilers are facing one of those recurring decisions, that many teams are facing this off-season, as they’ll be searching for a goaltender to potentially start a significant number of games in the upcoming year. The Oilers goalie depth chart features Mikko Koskinen, a 32 year old with 101 NHL games on his resume, and under contract for two more seasons at $4.5 million per year, along with a group of goalie prospects that have a range of potential. This list currently includes Ilya Konovalov (age 22), Olivier Rodrigue (20), Stuart Skinner (21) and Dylan Wells (22).
Koskinen has shown reasonably well as a starter at the NHL level, having now played 93 regular season games and four playoff games for the Oilers since transitioning from the KHL and SM-liiga in 2018. Among 53 goaltenders who have played at least 70 games over the last three seasons (approximately 3,000 minutes between 2017/18 and 2019/20), Koskinen’s even-strength (5v5) save percentage of 91.9% ranks 36th overall, while his goals-saved above average of -2.52 ranks 35th. The average team save percentage at even-strength over the same time period has been 92.04%, so it’s safe to say Koskinen has been a league-average goalie for the Oilers.
Considering how teams, especially in the west where travel is onerous, are moving away from a starter-backup approach to deploying goalies to more of a tandem where they can split ice-time more evenly, it’s important for the Oilers to continue doing the same. While Koskinen has provided decent netminding for the team, we know from a 2014 research article at Hockey Graphs that goaltender performance declines with age, especially after age 30 – and it’s beneficial for both Koskinen and the team if he has more time to rest between starts.
When the Oilers looked for a goalie last summer to split time with Koskinen, they signed Mike Smith, a 37 year old netminder at the time with 571 games of experience. How much time and effort was put into the analysis that led to this decision is unknown. But what we do know is that their approach to finding an NHL-caliber goaltender this off-season has to be considerably better.
Smith’s results as an Oiler were poor, which wasn’t surprising as the probability of goalies posting save percentages below league average levels increases after age 30 and accelerates after age 35. For more details about goalie aging curves, I’d recommend checking out this 2014 research article from Hockey Graphs.
This past season, Smith posted one of the worst save percentages in the league at even-strength (90.0%), ranking 52nd out of 54 goalies who played at least 1,000 minutes, or about 24 games, and allowed the fourth highest rate of goals against per hour (2.92). His individual performance was a big reason why the Oilers overall team save perentage was 25th in the league with 91.23%, allowing the sixth highest rate of goals-against, 2.72 per hour. That rate is slightly worse than what the Oilers allowed in 2017/18 when they allowed the eighth highest rate of goals (2.60 per hour) and and 2018/19 when they allowed the ninth highest rate (2.65 per hour). For context, the league average rate of goals against per hour over the last three seasons has been 2.45.
What management should hopefully be aware of is the fact that the Oilers allowed close to the league average rate of expected goals against. Expected goals measures the quality of the unblocked shots taken, and assigns a value to it depending on the probability of it becoming a goal. Key variables include the type of shot taken, where it was taken from and compares it to historical shot and goal data to determine the value. So while the actual rate of goals against the Oilers was 2.72 this past season, based on the variables from the shot data, the expected rate of goals against was 2.36 – slightly above the league average rate of 2.30.
Put another way, had the Oilers allowed the same rate and quality of shots against and received league average goaltending, they would have allowed approximately 136 goals at even-strength this past season. That’s a significant improvement of about 21 goals, (they actually allowed 157), which would translate to approximately three additional wins in the standings. And a key reason why this occurred and cost the Oilers a better spot in the league rankings is squarely on the player that management brought in last summer to shore up the goaltending.
2019/20 (5v5)
Smith
Koskinen
GP
39
38
TOI
1747.13
1702.87
Shots Against/60
29.09
33.23
Expected Goals Against/60
2.18 (19th)
2.58 (51st)
Save%
90.00% (52nd)
92.40% (23rd)
High Danger Save%
77.60% (52nd)
85.10% (9th)
Goals Against/60
2.92 (51st)
2.54 (34th)
Above is a summary of how the two netminders did for the Oilers in 2019/20 at even-strength. Included for some of the metrics is each goaltenders ranking among the 54 goaltenders who played at least 1,000 minutes this past regular season. What I found interesting was that the team’s rate of expected goals against, which again measures the quality of unblocked shot attempts, was higher when Koskinen was in net than when Smith was. Thankfully Koskinen did reasonably well, ranking 23rd overall among his peers with a 92.40% save percentage, just slightly above league average levels.
Whatever methods that the Oilers management used to determine that Smith was going to improve the team’s chances of winning games has to be under immediate scrutiny by someone in the organization. The publicly available data and research into goaltending made it clear that the probability of Smith posting league average numbers was low, which begs the question: what data and information and process was the team basing such an important decision on? What metrics were used and how well do these metrics correlate with targeted outcomes? Did they set out benchmarks and key performance indicators to measure their decision? How did the Oilers evaluate the probability of the player’s performance? Whose opinions were involved?
There has to be some level of accountability and proper evaluation of these key decisions – and it should come from someone outside of the hockey operations department. Preferably, above the general manager’s office, if Bob Nicholson has the motivation and courage to do so, or even an external consultant to ensure whatever the findings are can be actioned upon. The reality is that the second place finish in the division could be masking Smith’s poor goaltending performance, as Holland stated in his end of season media availability that goaltending was a strength. And there doesn’t appear to be any motivation for the general manager to dissect the goaltending decision from the 2019 off-season, leaving the team at risk of repeating the same mistake.
To improve their chances of landing a reliable goaltender this off-season and contend for the playoffs, it’s imperative that the Oilers evaluate how the decision was made to sign Smith last summer. The methods that were used were clearly flawed and it’s critical that management explore new ways – using data analysis, scouting and possibly an outside perspective – to evaluate goaltenders.
Expected goals: Measures the quality of the unblocked shots taken, and assigns a value to it depending on the probability of it becoming a goal. Key variables include the type of shot taken, where it was taken from and compares it to historical shot and goal data to determine the value. (Natural Stat Trick)
Goals saved above average – the goals this goalie prevented give his save percentage and shots faces vs. the league average save percentage on the same number of shots. Minimum four shots faced per team gamed needed to qualify (Hockey Reference)