Rolling along

ad8daac0-0432-11ea-bff1-ed2c5e3c142c.jpg

With the Oilers only posting a 50.94% goal-share at even-strength (5v5), I thought it’d be worth digging into how the Oilers have been doing at generating and preventing shot attempts and scoring chances this season, and if there might be some hope for the team to improve as they look to secure a playoff spot and (hopefully) do some damage in the playoffs. As I wrote in my last post, the special teams are outstanding, appearing sustainable, and it’s going to be a significant driver for their overall success. But the Oilers should still be targeting a stronger goal-share at even-strength.

  • Related: Power up – The SuperFan (2019, November 25)

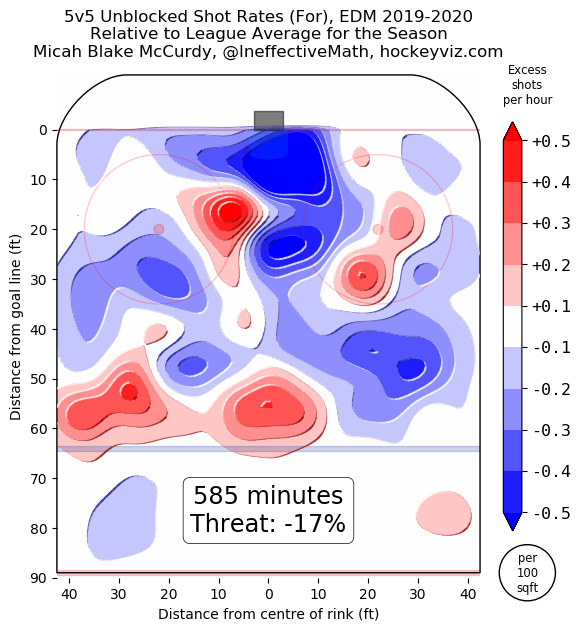
Quick snapshot of the Oilers current state at even-strength after 26 games. Glossary with a description of the metrics can be found in the appendix.

Goals
For%
Corsi
For%
Fenwick
For%
xGoals-for% Sh% Sv%
50.94%
(16th)
49.21% (21st) 49.61%
(17th)
50.95%
(13th)
9.10
(6th)
91.52
(18th)

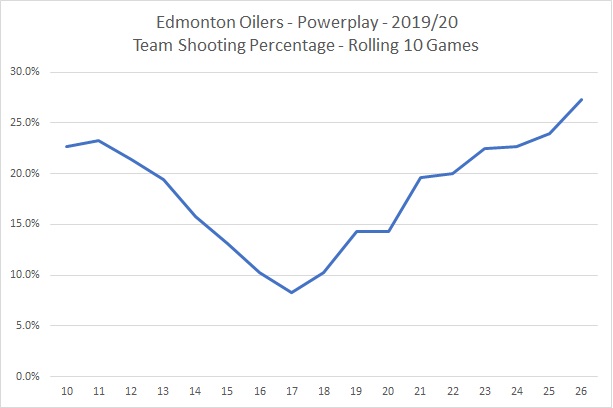
The good news is that the Oilers are just fine when it comes to underlying shot-share metrics, with the expected goal-share pretty darn close to the actual goal-share. What’s especially encouraging is that their numbers, especially Corsi For% (i.e., a proxy for possession) and Fenwick For% (i.e., a proxy for scoring chances) while appearing to be slightly sub-par, have gradually been improving over the course of the season and have at times hovered closer to the 51.0% mark. Below is a graph showing the Oilers shot-share metrics over rolling 10-game segments this season.

Rolling - 20191127.jpg

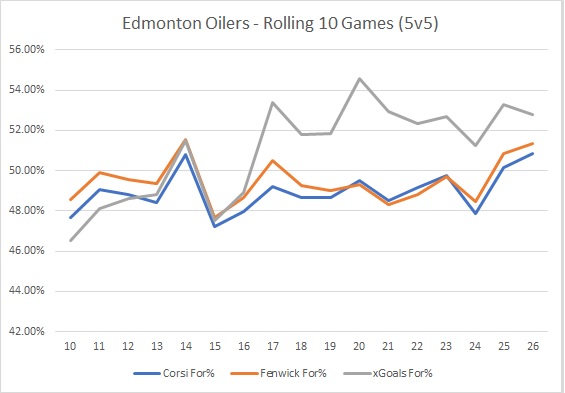
While the Oilers have posted a decent Corsi For percentage over the last 10 games (50.87%, 14th overall), their Fenwick For% of 51.35% has been 9th and xGoals For% of 52.78% has ranked 7th. The expected goal-share is what really stands out, as the team appears to be focusing on and getting better at creating more high-danger opportunities. Have to keep in mind too that this is a new coach, with a new philosophy, and it probably takes 20-25 games to get a group of players up to speed with the system and tactics.

And while the Oilers (including the top line) were struggling to generate shot attempts and chances earlier this season, things do seem to be gradually getting better offensively. Below are the rates of Corsi, Fenwick and Expected Goals for and against over ten game segments (apologies for the non-zero y-axes!).

Rolling Rates - 20191127

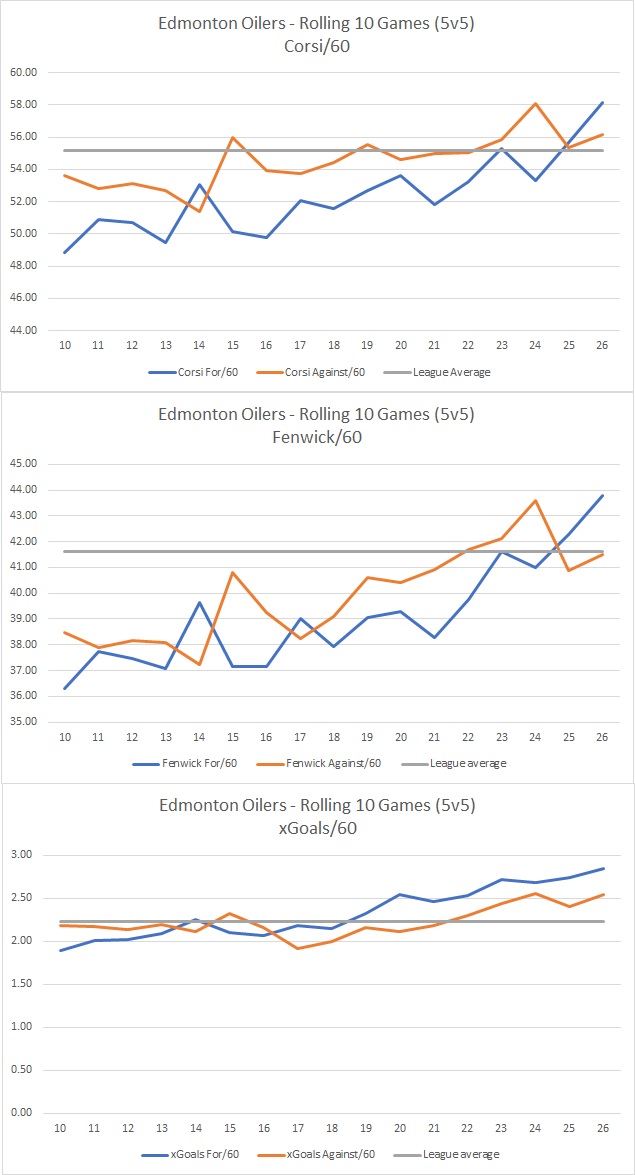
What’s interesting is that the team appears to be loosening up a bit defensively and perhaps willing to give up more chances in an attempt to create more, something I wasn’t expecting considering the talk all season about being better defensively and just how well they were suppressing shots. The Oilers were near the top of the league limiting opportunities earlier this season but have gradually regressed towards league averages. And the Oilers as a team do appear to be more focused on quality rather than quantity, just based on how strong the expected goal-share has been compared to the shot attempts and unblocked shot attempts.

Depth

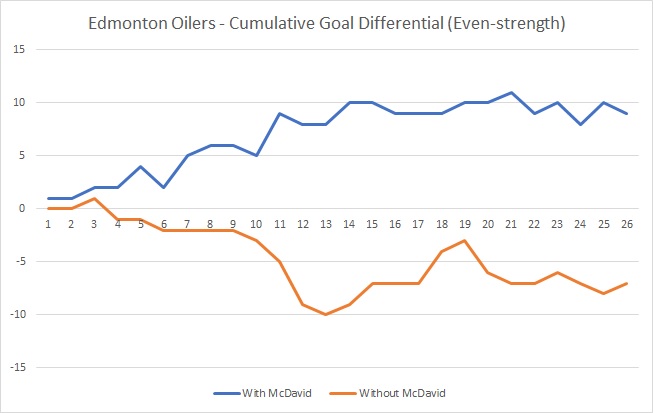
The good news is that the improved shot-share numbers appear to be a team-wide trend, and not just the top-line driving things. Here’s how the team has done at even-strength after 26 games with McDavid on the ice (used as a proxy for the top line) and without McDavid (proxy for the depth players).

Oilers
(5v5)
Goals For% Corsi For% Fenwick For% xGoal
For%
Sh% Sv% PDO
With
McDavid
59.61 49.59 49.11 51.04 13.33 91.27 1.046
Without
McDavid
42.81 48.99 49.91 50.89 6.39 91.69 0.981

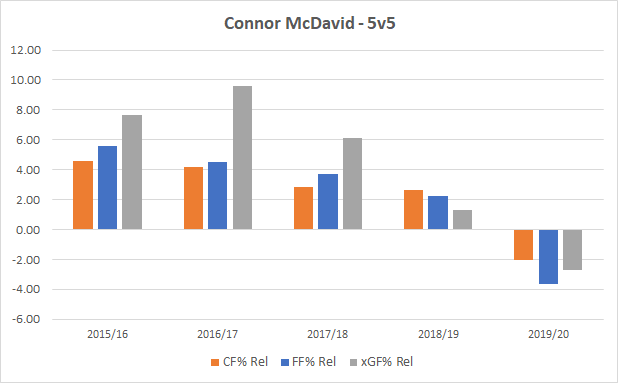
Breaking things down further over rolling 10-game segments, we see McDavid’s numbers drastically improving, perhaps a sign that his injury is healing well, and driving the overall results. But we also see that the team without their captain on the ice has been hovering around the 50.0% shot-share mark for most of the season and even seeing a brief spike in terms of expected goals – signalling that they’re getting quality chances more frequently. While the finishing talent isn’t there, it’s a good sign that the team has the right processes in place to improve their chances of scoring goals at even-strength without McDavid on the ice.

Rolling Rates w and wo 97- 20191127

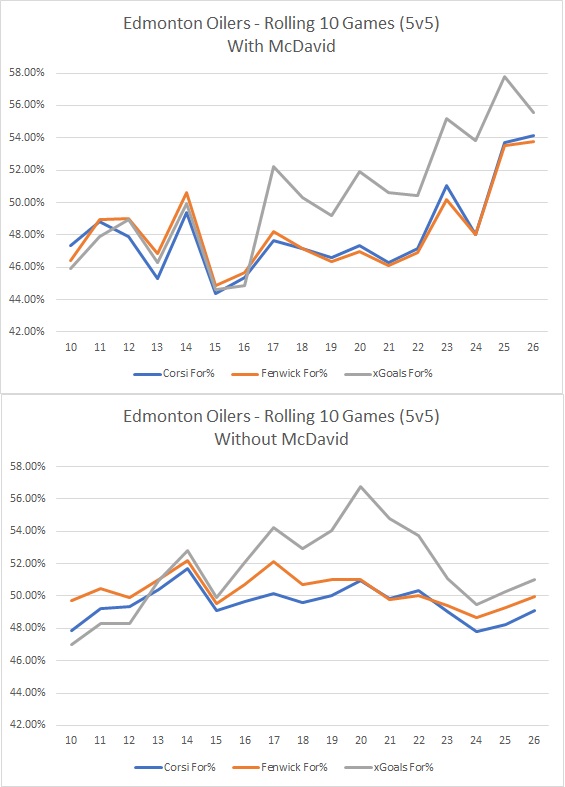
Now most of the Oiler’s shots-share success without McDavid on the ice has been largely driven by the teams ability to suppress chances and basically do nothing else offensively. That appears to be changing as the group has gradually been allowing a lot more, but at least are generating more quality chances offensively.

Rolling Rates wo 97- 20191127.jpg

Thoughts

While the current goal-share at even-strength is just under where they probably should be (~52.0%), there are signs that the Oilers have the right tactics and processes in place that will improve their chances of better out-scoring opponents. The team’s possession numbers and share of scoring chances are trending upwards, and hopefully it continues as they work on holding down a playoff spot. The good news is that this is a team-wide trend with McDavid posting stronger shot-share numbers as he and his line are generating more and more, and with the depth forwards holding their own generating more high danger chances and posting decent shot-share numbers. The concern I would have with the team as a whole giving up more chances (potentially in an attempt to create more offensively) is that their goaltending remains a little suspect, especially with Mike Smith still getting plenty of playing time. He currently ranks in the bottom five among 38 goalies (>500 minutes) when it comes to save percentage and goals-saved above average.

I also wouldn’t mind seeing the talent get dispersed a little more, with perhaps Draisaitl playing  a little more frequently on the second line at even-strength, especially with Nugent-Hopkins currently out of the line-up. There clearly aren’t enough finishers on the team, so perhaps with the points accumulated and the upward trend of underlying numbers, it might be time to start exploring the trade market. The focus being of course on trading from areas of strength and constructing a roster that can regularly compete for a championship.

Data: Natural Stat Trick

Glossary:

  • Goals For percentage (GF%) – The proportion of all the goals the scored for and against that the Oilers scored (i.e., Goals For/(Goals For + Goals Against).
  • Corsi For percentage (CF%) – The proportion of all the shot attempts the team generated and allowed that the team generated (i.e., Corsi For/(Corsi For + Corsi Against). This is used as a proxy for possession and can predict a team’s future share of goals (GF%).
  • Fenwick For percentage (FF%) – The proportion of all the unblocked shot attempts the team generated and allowed that the team generated (i.e., Fenwick For/(Fenwick For + Fenwick Against). This is used as a proxy for shot quality and considers shot blocking a repeatable skill. It can also predict a team’s future share of goals, slightlty better than Corsi.
  • Expected Goals For% (xGF%) – This is a weighting placed on every unblocked shot based on the probability of the shot becoming a goal. This depends on the type of shot, location and uses historical shot and goals data to come up with the probability for each unblocked shot.
  • Shooting percentage (Sh%) – The percentage of the team’s shots on goal that became goals (i.e., total goals divided by the total shots on goal).
  • Save percentage (Sv%) – The percentage of the team’s shots on goal against that were saved (i.e., 1-(totals goals allowed divided by the total shots on goal against).

Power up

oilers-winger-james-neal-takes-a-shot-tuesday-against-the-islanders

With special teams being such a driving factor behind the Oilers success this season, it’s important to put things into perspective and get a sense of just how much of the game is played on the powerplay and penalty kill, and what share of the total goals are scored there.

The harsh reality is that despite a fifth-ranked 0.673 points percentage, the Oilers aren’t very good at even-strength having posted only a 50.86% goal-share, ranking 16th in the league. Over the last three seasons, nine of the ten teams that had a points percentage greater than 0.600 posted a goal-share of 52.0% or more at even-strength. And ten of the last twelve teams that made it to the conference final series had a goal-share of 52.0% or more in the regular season at even-strength. That’s probably a fair target for any team that wants to be a legitimate contender.

The big issue remains the Oilers depth scoring at even-strength – basically the team’s offensive output when McDavid isn’t on the ice.  Right now, the Oilers are close to pretty much giving back the goals that McDavid and the top line are generating, which is unfortunate considering the seasons he and Draisaitl are having. With McDavid, the Oilers have a 57.63% goal-share, and without him the Oilers have a 44.26% goal-share.

oilers GDiff - 20191125.jpg

Currently, the Oilers only have a +2 goal-differential (59 goals for, 57 goals against) at even-strength, making it even more important that the Oilers continue excelling both on the powerplay (currently scoring 12.53 goals for per hour, 2nd overall) and the penalty kill (currently allowing 4.24 goals against per hour, 2nd overall).

cropped_GettyImages-1176740462.jpg

In the three regular seasons prior to the current one, teams played on average 8.20% of their total time on the powerplay (which also means the same average time percentage exists for penalty kill), with 23% of the total goals scored league-wide occurring on special teams. After 26 games, the league average time spent on the powerplay is 8.90% with the Oilers ranking second last in the overall with 7.27%. Despite that, they  have scored 24 of their 83 totals goals on the powerplay (28.9%), thanks in large part to a league-leading 21.05% team shooting percentage.

The big question is if they can continue generating on the powerplay at a rate that will prop up their overall goal-differential. One way to determine if the results on the powerplay are real or not is to take a look at the teams ability to generate unblocked shot attempts (i.e., Fenwick, also a proxy for scoring chances). I tend to use Fenwick to take into account the act of blocking shots, which is a standard tactic for penalty kill units. In my mind, good powerplay units find lanes and get shots through, which can be captured by the Fenwick metric.

The Oilers currently rank third in the league when it comes to generating unblocked shot attempts on the powerplay with 85.07. Over the last three regular seasons, teams generated on average 74.80 unblocked shot attempts, putting the Oilers in elite company as only five teams over the last three seasons have generated more than 85.0 unblocked shot attempts per hour in a season.

What’s promising is that the Oilers have remained consistent throughout this season in generating chances, thanks to their high-end talent remaining healthy. The current league average of 71.84 is represented by the orange line.

oilers FF - 20191125

The concern of course will be if the Oilers can maintain a 21.05% shooting percentage on the powerplay, which we should expect to fluctuate over the course of the season. The average team shooting percentage over the last three seasons has been 13.3%, with only one team finishing a season with a shooting percentage above 20.0%.

oilers PPSH - 20191125

The Oilers did see a dip in their shooting percentage earlier this season, but have bounced back nicely shooting over 25.0% on the powerplay over the more recent ten game segment. We can absolutely expect the shooting percentage to drop – it’s already happened – but I don’t think it’s out of the realm of possibility that the team finishes well above the league average rate considering the high-end talent the Oilers currently have.

One other note.

WheatNOil posted an interesting metric (Macaroni!) that captured a team’s special teams output, combining the rate of goals scored for and against on the powerplay and penalty kill (i.e., PP GF/60 – PP GA/60 + PK GF/60 – PK GA/60). Not susprisingly, the Oilers currently rank near the top of the league.

Out of curiosity, I replicated Wheat’s method for the last three seasons combined to see how it roughly correlates with a team’s points percentage. Below are the results, sorted by the Special Teams combined goal rates. I also included each team’s goal-share (GF%) at even-strength.

Team (2016-2019) Points % Special Teams – Combined Goal Rates Even-strength GF%
Tampa Bay Lightning 0.681 2.93 54.50
Boston Bruins 0.638 2.53 53.71
Toronto Maple Leafs 0.610 1.69 52.77
Pittsburgh Penguins 0.632 1.60 53.09
Washington Capitals 0.665 1.17 55.46
Florida Panthers 0.535 1.13 47.01
San Jose Sharks 0.610 1.13 51.42
Vegas Golden Knights 0.616 1.06 52.83
Minnesota Wild 0.589 0.94 51.80
Winnipeg Jets 0.610 0.93 52.61
Calgary Flames 0.579 0.53 51.51
New York Rangers 0.522 0.41 48.08
New Jersey Devils 0.486 0.33 44.67
Nashville Predators 0.632 0.31 54.49
Anaheim Ducks 0.581 0.21 50.56
Los Angeles Kings 0.518 0.00 49.05
St Louis Blues 0.593 0.00 52.04
Carolina Hurricanes 0.547 -0.13 48.31
Columbus Blue Jackets 0.616 -0.23 53.91
Buffalo Sabres 0.439 -0.49 42.71
Colorado Avalanche 0.474 -0.52 46.72
Edmonton Oilers 0.528 -0.75 49.18
Dallas Stars 0.537 -1.01 50.50
Arizona Coyotes 0.459 -1.11 44.95
Montreal Canadiens 0.549 -1.27 50.67
Ottawa Senators 0.465 -1.48 45.49
New York Islanders 0.563 -1.65 51.19
Vancouver Canucks 0.453 -1.88 45.29
Detroit Red Wings 0.459 -2.01 45.61
Philadelphia Flyers 0.545 -2.10 49.14
Chicago Blackhawks 0.547 -2.52 50.56

The team’s with the best combined special teams often did well overall, with eight of the ten teams posting a points percentage above 0.600 (which would have them comfortably top ten in the league). That’s not exactly ground-breaking information – if you’re killing it on both special teams, you’re improving your chances of finishing the season well. What does stand out is that of those top ten clubs that had solid special teams, seven also posted a goal-share of 52.0% or more at even-strength. Again, nothing earth shattering, but it does confirm that if the Oilers want to finish in the top half of the league, they can rely all they want on special teams, but they also need their even-strength goal-share to be better. Might be something worth digging into more, but at least it sets up a few reasonable targets to track as the season progresses.

Data: Natural Stat Trick

After 20 games, the key drivers and areas worth monitoring

tippett

The Edmonton Oilers are first place in the Pacific division with a 0.650 points percentage (+7 goal differential, 3rd in the division), leading many including myself to question if this team is real or not. We’re 20 games into the season, so it’s worth looking into what the drivers have been for the Oilers success and try to uncover any issues worth monitoring.

Starting with goaltending, which has been good so far. The Smith/Koskinen tandem has posted a team save percentage of 91.27 (all situations), good for tenth in the league. At even-strength, the Oilers’ team save percentage ranks 15th in the league with 92.21% – right around where we should expect them to be. Among 50 goalies who have played at least 250 minutes at even-strength (5v5), Koskinen ranks 8th in terms of save percentage with 93.6%, while Smith ranks 39th with 90.7% (average is 91.7%). Hopefully, Oilers management is seeing the benefits of splitting the workload between two capable netminders and refrain from overspending next summer on the goaltending position.

The powerplay has been dynamite, scoring 10.66 goals per hour (second best in the league). The Oilers are relying on their first unit, similar to what they did last season, loading up with their high end talent and getting major contributions from secondary options like James Neal. While the team can expect to see their shooting percentage regress towards league average rates (13.2% over the last three seasons), it’s at least encouraging to see how great they’ve been consistently generating shot attempts (CF/60) and unblocked shot attempts (FF/60, a proxy for scoring chances). And the team’s rate of expected goals (xGF/60), which uses historical data to give each shot a probability of becoming a goal, reflects their ability to generate higher quality chances.

CF/60 FF/60 xGF/60 GF/60 Sh%
114.56 (3rd) 81.92 (6th) 7.78 (3rd) 10.66 (2nd) 18.6% (2nd)

With the team’s powerplay being this strong, it sure would be nice if the Oilers had the personnel to draw penalties more frequently. The Oilers have the third lowest rate of powerplay minutes per game – something that could be addressed if either the team played with more pace or if they had someone who had that speed and skill-set.

The Oilers penalty kill has also been a key driver for their success as they currently rank 3rd in the league allowing only 4.54 goals against per hour. It appears they’re relying quite heavily on their goaltending, which ranks third in the league, as they haven’t been very good at limiting shots and chances against.

CA/60 FA/60 xGA/60 GA/60 Sv%
97.34 (17th) 75.15 (19th) 7.55 (27th) 4.54 (3rd) 91.74 (3rd)

What’s interesting is that the Oilers have in fact improved over their last ten games, giving some hope that the penalty kill results may be sustainable. Below is a split of how the team has done this season.

Oilers CA/60 FA/60 xGA/60 GA/60 Sv%
Games 1-10 116.3 93.25 10.4 4.19 93.94
Games 11-20 79.74 58.35 4.9 4.86 88.37

Starting with the goals against per hour (GA/60), we see that the Oilers have been consistent allowing about four goals per hour, even though their goaltenders performances have slipped. Thankfully, the Oilers have cut their expected goals in half, indicating that they’ve done a better job at limiting the high quality chances. Worth noting that these numbers from the most recent ten games has them among the leagues best. I’d be curious to know what the coaching staff has done differently tactic-wise that would’ve impacted the results and underlying numbers.

Thinking through this more, I probably shouldn’t be too surprised that the team’s penalty kill figured things out defensively. They have been good all season limiting shots and chances at even-strength (5v5), ranking top ten in the league in various metrics.

A big reason why things have gone well is the emergence of Ethan Bear and how well he’s done playing top minutes against the best competition. Looking at how each defencemen’s on-ice Corsi For% relative to the team, I was surprised to see him leading the way. With Larsson still recovering and Caleb Jones being called up, the Oilers could have some big decisions coming up including how to handle Russell and Nurse. If Jones emerges as a legitimate NHL player, the Oilers left-side is much more solid and gives Oilers management some leverage in their negotiations with Nurse.

Should note that the reason I use Corsi Rel is because of the predictive value of Corsi For% and it’s relationship to goal-share, which I touch on later in the post. It’s not meant to be a definitive metric, but it gives us a sense of what’s happening and can drive further questions and analysis.

20191113 - Defencemen CorsiRel

As great as those things have been, there are definitely issues worth monitoring.

The first issue is the team’s underlying shot-share numbers at even-strength, which are a good predictor of future outcomes. The Oilers currently rank 23rd in the league with a 48.62% Corsi-for percentage (a proxy for possession) and 20th with a 48.93% Fenwick-for percentage (a proxy for scoring chances). These are numbers that a coaching staff can influence through tactics and how they deploy the roster. But so far, it looks like it’s only getting worse.

20191113 - CF Rolling 10.png

The poor Corsi For percentage at even-strength is largely driven by the Oilers inability to generate offensive opportunities, as they rank 26th in terms of shot attempts per hour with 51.23 and 28th when it comes to unblocked shot attempts (i.e., scoring chances) with 37.79. If the Oilers hope to improve their rate of 2.40 goals per hour (17th overall), they’ll need to figure out how to carry the play and spend more time in the offensive zone. It shouldn’t be too much to ask for the team to post shot-share metrics above 50%. But considering the roster construction, we probably shouldn’t be surprised.

That leads me to my next point.

What’s especially troubling is that it’s not just the depth players dragging down the team’s overall performance – it’s the star players as well who are getting out-shot and out-chanced when they’re on the ice.

Below are the Oilers forwards who have played at least 65 minutes at even-strength this season and their Corsi For% relative to the team.

20191113 - Forwards CorsiRel

The key focus here is on McDavid and Draisaitl, who have no doubt been outstanding so far this season. But it’s definitely concerning to see how poorly they rank within a team that’s posting poor shot-share numbers. McDavid specifically, as crazy as it might sound, hasn’t looked 100%, perhaps because of the injury from last season or the fact that he and Leon have been leading the league in ice-time per game.

I usually save these graphs for when I look at depth players and their history relative to their teammates. But I had to see just how far off McDavid has been from his historical numbers. I suspect last season had to do with Hitchcock’s coaching tactics and being overplayed. I’d be curious to know if similar impacts combined with his injury recovery are driving his numbers down like this.

20191113 - McDavid Rel

The fact that a player like McDavid is posting these numbers should shine a light on management and the coaching staff. Yes the player is posting excellent results and the team is doing well. But is there something the coaching staff could do differently to get their star players more scoring opportunities. Are they aware that their even-strength results (i.e.,  goal-share) may not be sustainable? And is there something management could do to mitigate the risk of injuring a star player who is critical for the long-term success of the franchise?

It’s been a great start to the season, and the team has greatly improved their chances of making the playoffs. But there remains major issues both with the roster construction up front and the coaching staff’s offensive tactics that has me questioning the teams ability to keep pace in a competitive division.

Data: Natural Stat Trick

CBC Radio Active: Oilers quarter season checkup

cbc edmonton logoI joined host Rod Kurtz on CBC Radio Active to talk all things Oilers. Full segment is here: CBC Radio Active (2019, November 12)

Topics we covered:

  • The dismissal of Don Cherry.
  • The Oilers strong start, and the key drivers including goaltending and special teams.
  • Areas for concern, including the number of close games, lower-than-average shot shares and the competitiveness of the Pacific division.

Big thank you to everyone at CBC for putting it together!

Issues generating offence

connor-mcdavid

The Oilers even-strength (5v5) scoring issues remain a major concern, with the team only scoring 2.11 goals for per hour, ranking them 25th in the league. It’s only thanks to excellent goaltending and their ability to limit shots and chances against that their goal-share is a respectable 50.88% (14th in the league).

It’s great that the powerplay and penalty have helped keep their overall goal-differential just above break-even, and hopefully their special teams (especially the penalty kill) can remain at or above league-average rates. But it’s in the Oilers best interest to identify their underlying issues in the most time-consuming game state and try to generate more offence.

The biggest problem for the Oilers at even-strength has been their inability to generate scoring opportunities on a consistent basis. The team current ranks near the bottom of the league when it comes to shot attempts, unblocked shot attempts (used as a proxy for scoring chances) and expected goals, which uses historical data to give each shot a weighting to determine the probability of the shot becoming a goal.

2019/20 CF/60 FF/60 xGF/60 GF/60 Sh%
Oilers 50.21 (27th) 37.03 (29th) 2.06 (25th) 2.11 (25th) 7.74 (20th)
League Average 54.98 41.44 2.22 2.53 8.32

It appears based on shot-location data that the Oilers are having major issues getting opportunities from high-probability areas this season – something we should expect the coaching staff – through potential system adjustments – and perhaps management, to address if the team intends on competing for a playoff spot.

What’s concerning is that this issue is a continuation of one of last season’s biggest problems, as the Oilers finished in the bottom five league-wide not only in goal-scoring, but also shots and scoring chances. In fact, the Oilers are currently slightly below the offensive rates they posted en route to a 79-point/0.482 point-percentage season in 2018/19.

2018/19 CF/60 FF/60 xGF/60 GF/60 Sh%
Oilers 51.90 (28th) 38.53 (29th) 2.13 (26th) 2.17 (26th) 7.68 (21st)
League Average 56.5 42.26 2.3 2.47 8.07

It’s obvious that the Oilers are lacking the talent and depth to out-score opponents on a nightly basis.

But it’s worth noting that the Oilers top line featuring McDavid and Draisaitl is also having issues generating shots and scoring chances – numbers that are closer to league average rates. Below are their on-ice rates together at even-strength from this season (250 mins) and last season (805 mins).

McDavid/Draisaitl CF/60 FF/60 xGF/60 GF/60 On-Ice SH%
2019/20 51.94 39.30 2.58 4.47 15.11
2018/19 57.72 44.01 2.60 4.20 13.10

The Oilers can take solace in the fact that McDavid and Draisaitl are putting up points and have an on-ice rate of 4.47 goals-per hour. But the fact that their on-ice rate of shot attempts and unblocked shot attempts have slipped should be a flag for the team. I’d expect the coaching staff to explore ways for their star players to get more shots and chances to sustain their current scoring rate and also to potentially push their production further. And part of the Oilers’ analysis has to include a review of their star players ice time, which continues to be one of the highest in the league.

Adjustments both to the roster and the tactics have to be made if the Oilers want to make a serious run for a playoff spot.

Data: Natural Stat Trick, HockeyViz


The SuperFan Podcast – Episode 8 – Darcy McLeod (aka Woodguy)

3000by3000 (1)This week on the podcast, I was joined by Darcy McLeod, also known as Woodguy online. Darcy and I chatted about the Oilers progress this season, what some of the drivers have been and potential areas for concern. We also discussed goaltending, and prospect development/deployment, and how the Oilers could handle their line-up in the short-term and long-term. Darcy also shared the story and methodology behind PuckIQ – a fantastic resource that allows fans to see how individual players have fared against varying levels of competition.

Big thank you to Darcy for sharing his knowledge and insight!

Full segment below:

Links mentioned in the podcast:

Podcast channels:

Music: Anitek. “Show me.” Anitek Instrumentals Vol. 4, 2010. Jamendo.com


Tracking the Pacific Division – As of October 31, 2019

21780497

The Oilers had a lot of success in October, going 9-4-1 in the month and collecting 19 points in 14 games. They sit first overall in the Pacific based on points, but if you factor in the number of games played and the points available, they finished second in their division with a points-percentage of 0.679 behind only Vancouver.

Something I started doing last season was tracking how the Oilers compared with their division rivals at even-strength (5v5) on a month to month basis. Metrics like points, points-percentage and goal-share (GF%) at even-strength gives us a snapshot of the current results. And underlying shot-metrics like shot attempts and expected goals gives us a sense of which teams in the Pacific are for real, and which ones might have issues to address if they want to contend for a playoff spot.

Below are the results as of October 31, 2019, with teams sorted by points-percentage. For each of the shot-share metrics, I’ve applied a basic heat-map to show which teams are doing well compared to the division teams and which are struggling.  A description of each metric is at the end of this article.

Pacific Division - 20191031

Couple thoughts:

  • It’s a little concerning that the Oilers possession numbers are poor relative to their division. The big problem is their offensive output, as they rank near the bottom of the league when it comes to shots and chances at even-strength. It’s a team-wide problem that hopefully gets addressed.

  • The Oilers goal-share is right in line with their expected goal-share, which unfortunately is below 50%. Not many teams get into the playoffs with a negative goal-differential, but the fact that they have collected points puts them in a good spot to at least be contending for a playoff spot.
  • I’m honestly surprised to see the Vancouver Canucks doing so well at even-strength and that they’re doing well when it comes to the underlying shot-share metrics. The Canucks powerplay is sitting at 12th overall in the league scoring 8.79 goals per hour. I suspect those results will improve considering that they’re top five in the league when it comes to shot attempts and scoring chances (i.e., Fenwick) per hour.
  • I knew San Jose was struggling, but I did not realize how badly they were getting out-shot and out-chanced. It also doesn’t help that their goaltending has been poor, something that was an issue in years past but was masked by the team’s offensive output. Bright spot – their powerplay is generating a ton of shots and scoring chances on the powerplay, which ranks fifth in the league.
  • Suspect Vegas will climb back into the top three of the Pacific by the end of 2019. They’re playing well as a team, but just haven’t converted on their chances. Their powerplay has been dynamite, scoring 10.34 goals per hour (4th in the league) and sitting near the top of the league when it comes to shots and chances.
  • And here I thought the Oilers powerplay had an advantage over their division rivals. Vegas, Vancouver and San Jose are all top five in the league when it comes to shots and chances. Thankfully the Oilers aren’t too far behind them.
  • Arizona is going to be the team to watch. Excellent shot-share numbers, but I’m not convinced that they have the finishing talent – similar to their story last season.

Data: Natural Stat Trick, Hockey Viz

Glossary:

  • Points-percentage (Point%) – The total points accumulated divided by the points that were available, including extra time.
  • Corsi For percentage (CF%) – The proportion of all the shot attempts the team generated and allowed that the team generated (i.e., Corsi For/(Corsi For + Corsi Against). This is used as a proxy for possession and can predict a team’s future share of goals (GF%).
  • Fenwick For percentage (FF%) – The proportion of all the unblocked shot attempts the team generated and allowed that the team generated (i.e., Fenwick For/(Fenwick For + Fenwick Against). This is used as a proxy for shot quality and considers shot blocking a repeatable skill. It can also predict a team’s future share of goals, slightly better than Corsi.
  • Shots For percentage (SF%) – The proportion of all the shots on goal that the team generated and allowed that the team generated (i.e., Shots For/(Shots For + Shots Against).
  • Expected Goals For percentage (xGF%) – This is a weighting placed on every unblocked shot based on the probability of the shot becoming a goal. This depends on the type of shot, location and uses historical shot and goals data to come up with the probability for each unblocked shot. This has been found to be a better predictor of future goals than Corsi and Fenwick.
  • Goals For percentage (GF%) – The proportion of all the goals that the team scored and allowed that the team generated (i.e., Goals For/(Goals For + Goals Against).
  • Shooting percentage (SH%) – The percentage of the team’s shots on goal that became goals (i.e., total goals divided by the total shots on goal).
  • Save percentage (SV%) – The percentage of the team’s shots on goal against that were saved (i.e., 1-(totals goals allowed divided by the total shots on goal against))
  • PDO – The sum of a team’s shooting percentage (SH%) and its save percentage (SV%). It’s based on the theory that most teams will ultimately regress toward a sum of 100, and is often viewed as a proxy for how lucky a team is. (Source)