After the first four games, the Oilers have scored a grand total of five goals: two at even-strength, two short-handed and one on the powerplay. San Jose is the better team right now when it comes to actual goals, thanks to their outburst in game four and the four powerplay goals.
| Team | Even-strength | Powerplay | Shorthanded |
| Edmonton | 2 | 1 | 2 |
| San Jose | 5 | 5 | 0 |
I’m fairly confident that the Oilers powerplay will start to click again, considering they had great, sustainable results during the regular season, as they generated a lot of chances with the man-advantage.
The Sharks penalty kill wasn’t that great in the regular season as they allowed a lot of shots and realied heavily on their goaltending to bail them out. And the Sharks powerplay, which was one of the worst in the league in terms of goals and ranked below league-average in terms of shots, isn’t likely to ever score four again in a game.
Related: The Oilers Powerplay Could Be the Difference Against San Jose – The Copper & Blue (2017, April 11)
I think the issue for the Oilers is their even-strength play. Here’s how the two teams have done over the first four games.
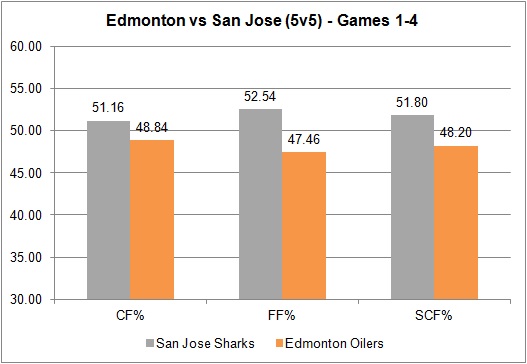
Across all three metrics, Corsi (proxy for possession), Fenwick (proxy for shot quality) and scoring chances, the Sharks have been in control. It was only in game two that the Oilers had a share of 50% or more: CF% – 69.12, FF% – 72.09 and SCF% – 82.76. What’s interesting is that even when they dominated that game, they still could not score at even-strength, as both goals came shorthanded.
Another thing worth noting here is how poorly the Oilers have played when the score has been within one. In 135 minutes (of a total 172 5v5 minutes), CF% – 46.62%, FF% – 44.44%, SCF% – 45.38%.
What has to be emphasized are the shooting and save percentages for each team over these four games.
| Team (5v5) | Shooting% | Save% |
| San Jose Sharks | 5.88 | 97.30 |
| Edmonton Oilers | 2.70 | 94.12 |
Both the Sharks and Oilers were around league average when it came to shooting percentage in the regular season, 7.82% and 8.28% respectively. While the Sharks shooting percentage started correcting itself in game four, I think it’s safe to assume that the Oilers will eventually start converting more of their shots into goals, at least in the next two games.
As for the save percentage, we know Martin Jones is a good goalie. But I highly doubt he’ll maintain a 97% save percentage, considering he finished the regular season around the 92-93% range.
We can take the team’s struggles at 5v5 one step further and look at how the players are doing. What I’ve done below is list out the four centers, sorted by ice time, and listed their Corsi, Fenwick and Scoring Chance differentials, along with their on-ice shares.
| McDavid | RNH | Letestu | Desharnais | |
| TOI | 51.25 | 45.45 | 39.25 | 31.38 |
| CF Diff | 5 | 3 | -7 | -4 |
| CF% | 52.34 | 51.69 | 45.07 | 45.83 |
| FF Diff | -6 | 8 | -11 | -2 |
| FF% | 45.45 | 56.06 | 39.62 | 46.88 |
| SCF Diff | -2 | 3 | -2 | -1 |
| SCF% | 47.62 | 54.29 | 46.43 | 45.45 |
When it comes to possession, McDavid and RNH appear to be doing well, which is great news considering that they play against the other team’s top players. Letestu and Desharnais, despite playing the secondary lines, aren’t exactly getting the job done at 5v5. Letestu is a valuable piece on the powerplay, but I’d be curious to see if the Oilers move him to wing, and play Draisaitl more often at center. Desharnais on the other hand could easily be replaced by Lander or even Hendricks, who can both play on the penalty kill (unlike DD). I mention the penalty kill because RNH is seeing a ton of minutes shorthanded, which disrupts his 5v5 line that’s been very reliable over the past four games.
When it comes to shot quality (again, I’m using Fenwick as my proxy), it appears that every center except for RNH is doing poorly. McDavid with a -6 differential is very surprising considering his talent level, but it might have to do with San Jose sending out Vlasic and Braun out against him on a regular basis. With game five at home, it’ll be important for McLellan to get McDavid out there as much as possible and away from the pairings that have been causing him issues.
Looking at the Oilers defence, it appears that the usual suspects are on the ice for a higher rate of shot attempts and scoring chances against. The Sekera-Russell pairing, which played similar competition as the Klefbom-Larsson pairing, continues to struggle suppressing shots.
| Player | TOI | CA/60 | FA/60 | SCA/60 |
| Larsson | 66.02 | 57.26 | 39.99 | 20.90 |
| Klefbom | 60.07 | 51.94 | 33.96 | 17.98 |
| Russell | 57.83 | 69.51 | 45.65 | 24.90 |
| Nurse | 54.97 | 57.85 | 42.57 | 22.92 |
| Sekera | 54.87 | 67.80 | 45.93 | 27.34 |
| Benning | 39.10 | 46.04 | 36.83 | 21.48 |
The fact that the Oilers are posting lower than 50% shares of shot attempts and scoring chances should be a concern for the club. A lot of the issues they’re currently having (poor outputs from depth centers, higher than normal shots against when certain defencemen are out) were identified in the regular season, but weren’t addressed by management. Now that they’re in the playoffs, they’ll have to hope McDavid and the top line can break out, and the team shooting percentage regresses towards their season long average. I know I’d have a lot more confidence if their shot-shares were better.
Data: Natural Stat Trick
