Last week, I looked into the performance of the Oilers depth forwards and defence core against different levels of competition using the WoodMoney metric. What we can do using this data is parse out how individual players did against three categories of forwards, and add another level of information to our analysis. The full rationale for the metric, the methodology to classify players and the complete data-set can be found at Because Oilers.
Here’s a quick breakdown of the different competition groupings.
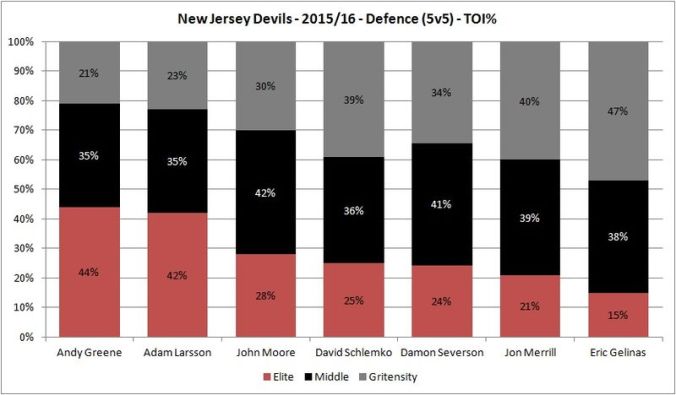
Elite: at least one elite player must be on the ice. No Gritensity players may be on the ice.
Middle: Elite + Gritensity on the ice, or 3 mudddles
Gritensity: Any time a gritensity player is on the ice except when with an Elite.
I received a couple of requests to look into how Adam Larsson did last season as a New Jersey Devil using the WoodMoney data. What we know from some of the more established metrics available at Corsica Hockey and Hockey Analysis is that Larsson played predominantly with Andy Greene, starting a significant number of shifts in his own zone and actually fared pretty well when it came to limiting shot attempts, scoring chances and goals. We also know that when it came to offence, Larsson is a bit of a black hole as the team didn’t generate a whole lot with him on the ice.
Using the WoodMoney data, we can look into how Larsson did against the different levels of competition, including his proportion of ice, shot attempts against and Dangerous Fenwicks against.
Full article is at The Copper & Blue.
