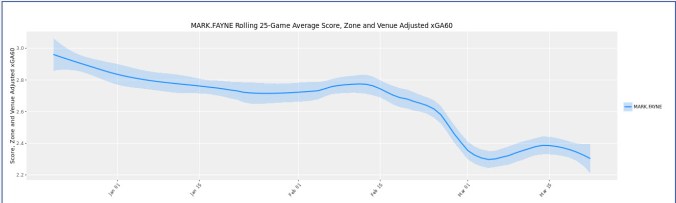
 At the start of the season, it appeared all hope was lost for defenceman Mark Fayne. He was clearly struggling with the new system, as foot speed and reaction time appeared to be an issue. His numbers reflected it, as the shot attempts against and the shots on goals against often increased when Fayne was on the ice. This translated into a higher expected goals against/60, which factors in shot type, distance and angle, and if the shot was a rush shot or a rebound. More on how shot quality is calculated can be found at Corsica Hockey.
Here’s how the most common Oilers defenceman did as of December 9th, 2015, the day that Fayne was demoted to Bakersfield. I looked into the defensive rates (i.e. “per 60”) metrics: shot attempts against (CA/60), unblocked shot attempts against (FA/60), shots on goal against (SA/60) and expected goals against (xGA/60). Please note that the stats are score, zone and venue adjusted, based on Corsica Hockey’s methods, to give a more accurate assessment of player performance. Tables are sortable.
Full article is at The Copper & Blue.
