It’s been a little weird seeing how much hype there is around the Edmonton Oilers heading into the season. They’re obviously in that championship contender category, coming off a deep playoff run this past spring. And they have the high-end talent that will help drive results.
I’m just seeing a few too many question marks around the roster, so I’m not as confident as the general public about the Oilers this season.
For one, I’m not sold on the goaltending as Stuart Skinner has had a lot of ups and downs over the course of his career. I view him as an average goalie, not someone who can steal wins like some of the other elite level goalies. And don’t get me wrong, average goaltending can be good enough. I just don’t think the Oilers did enough to mitigate the risk of his play falling off, like what’s happened to him early on in regular seasons. Pickard as a backup is fine, but can you trust him for an extended period in case Skinner needs time away? I’m not completely sold.
The other issue is around the third and fourth lines, which looks significantly slower than last season. I don’t like the idea of Henrique centering Janmark and Brown. And then a fourth line with two players over 37 years old. Hoping Podkolzin can make an impact, and you have Philp and Savoie as options down the road. But for now, that bottom six is a perfect target for opposing teams. I think you need some more speed and skill to be effective in those minutes. Keep in mind too – guys like McLeod, Holloway and Foegele posted some of the best on-ice shot-share numbers for Edmonton last season, and were a big reason why the bottom six was improving. It’ll be interesting to see if the team’s shot-share numbers at even-strength take a hit, especially when McDavid isn’t on the ice.
The Oilers top six is arguably one of the best in the league. But there’s a few guys that are at risk of regression. Hyman for one, likely won’t reach 50 goals again based on his career shooting percentage levels. Nugent-Hopkins was pretty quiet in the playoffs and has had periods throughout the last few seasons where his on-ice shot share numbers were lower than expected. I’m also tempering my expectations for Arvidsson whose skillset is very valuable when he’s healthy. Coming off a shortened season, you don’t know how quickly a player can get back up to speed – similar to what happened to Connor Brown last year. Draisaitl is also someone who I’ve always felt needs a centerman on his line to be effective, so I don’t know how well he’ll work with J. Skinner and Arvidsson. Skinner, while very productive, is also going to frustrate some with his defensive play. Expecting some line-tinkering early on in the year.
As for the blue line, I’m not quite sure what to expect. The team is taking a risk relying on Emberson, Stecher, Dermott and J. Brown to be regulars. Emberson has the most potential but lacks experience. Stecher, Dermott and J. Brown have a history of being depth guys at best, so it’s hard to imagine them taking on larger roles over an extended period for Edmonton. It’ll also be interesting to see which defenceman take on penalty kill minutes. Assumed Emberson and J. Brown were going to replace Ceci’s and Desharnais’ minutes. But now with Brown sent down, it might have to be Dermott.
It’s going to be a fascinating season for the Edmonton Oilers who have a lot of pressure on them to win a championship. And if things go sideways early on, it’ll be critical that the coaching staff, and potentially management, act quickly.
The Edmonton Oilers head into the 2024/25 regular season with high expectations, and understandably so. Their group of forwards have two of the best players in the world in Connor McDavid and Leon Draisaitl, along with a good supporting cast. Their defence has some high-end talent in Evan Bouchard and Mattias Ekholm. And the team is coming off a playoff run where they were one win away from a championship.
Plenty will need to go right for the team to make another deep run in the playoffs. But before even getting there, the team really needs to have a good start to the regular season, which is something they’ve had trouble with the last two years now. A poor start has many downstream effects, including having to overplay players in important positions, like goaltending, just to make up ground in the standings. And not being able to rest star players to keep them fresh for the playoffs. A good start can also increase their odds of winning their division and securing home-ice advantage for the post-season. Something that hasn’t happened since the dynasty years.
Recent history
Two years ago, the Edmonton Oilers started the 2022/23 regular season with ten wins and ten losses in their first 20 games, ranking 20th in the league with a 0.500 points percentage. They were outscored 66-72 in all situations and had the fifth worst goal-share (42.86%) at even-strength (5v5) getting outscored 33-44. And while their powerplay was one of the best in the league, all their goals were wiped away by their penalty kill that allowed the fourth highest rate of goals against.
And last season’s start was even worse. In their first twenty games, they had seven wins, twelve losses and one overtime loss. This had them 29th in the league with a 0.375 points percentage, and only three points ahead of San Jose in the Pacific division. They were outscored 66-74 in all situations, and 38-46 at even-strength. That’s a goal-share of only 45.24%, which had them 26th in the league. And they had the same issue on special teams where the powerplay was outstanding (+16 goal differential), but their penalty kill was erasing all their success (-15 goal differential). Things eventually turned around, but it was a massive lift.
So what were the factors that caused these poor starts for the Edmonton Oilers?
Goaltending
The Oilers goaltending has struggled out of the gate two seasons in a row. In the first twenty games of the 2022/23 season, their team save percentage in all situations was 89.57 percent, which ranked 23rd in the league and 10th in the western conference. And in the first twenty games of the 2023/24 season, their team save percentage was 87.11 percent, which was 31st in the league and dead last in the western conference. A lot of the problems were on the penalty kill, especially earlier in the 2023/24 season where despite the Oilers doing a good job limiting the rate of shots and chances against, the goaltending was terrible ranking 25th in the league with a save percentage of 81.82 percent.
Skinner has the starting role, but it’s critical that the Oilers have a solid backup option ready in case he falters like he has in the past.
Poor finishing at even-strength
In the early parts of both seasons, the Oilers as a team had a lot of trouble burying their chances. Two seasons ago, they started the season with a 7.02 percent shooting percentage, which ranked 31st in the league. And they started last season with a 7.58 percent shooting percentage, which ranked 25th. League average shooting percentage over the last three seasons has been 8.55 percent, and the Oilers have been right around there with an 8.77 percent shooting percentage. Considering the talent level they have and the amount of money allocated to offensive players, their shooting percentage has to be better to start the season.
Which leads to the next factor.
Star players starting poorly
Last season, Connor McDavid had a rough start relative to his own standards – specifically at even-strength. McDavid didn’t look like himself, along with other teammates, likely driven by the fact that they started training camp earlier than normal, which resulted in injuries. McDavid himself missed a couple games and put up only eight even-strength points in his first 17 games – a point per hour rate of only 1.79. For context, McDavid has posted a rate just under three points per hour over the course of his career. So, this was exceptionally low relative to his career levels. His season did turn around soon after, and he went on to dominate the rest of the season. But it was a good reminder of how critical he is to the team’s success, and how difficult it is to replace his production when he’s not at 100 percent.
A similar issue had occurred the season prior when Leon Draisaitl struggled out of the gate in 2022/23. In the first twenty games that season, Draisaitl had only nine even-strength points, which translated to a points per hour rate of 1.76. That’s well below his career points per hour rate of 2.41 and the 2.51 he’s posted over the last three seasons. One contributing factor to his lack of production early that season was how often the Oilers played without the puck when he was on the ice. His on-ice share of shots and scoring were some of the worst on the team, with his Expected Goals For percentage sitting at 44.51 percent.
It took playing more often with McDavid to give those numbers a boost and at a production level closer to what we would expect from Draisaitl. Plus he needed to get healthier. Draisaitl was coming off a significant injury sustained in the playoffs that spring – so it was understandable that he would struggle. But again, it highlighted how important he is to the team’s early-season success and the lack of depth on the roster that season.
Thoughts
It’ll be interesting to see how the Oilers start the year after making a deep run in the playoffs and turning over a significant number of players on the roster. The hope is that everyone is healthy, and that training camp has given the group enough time to implement their tactics and build familiarity with one another. Goaltending will need to be league-average, along with the team’s ability to finish their chances. And if the star players can start off strong, that should alleviate some pressure and improve the team’s odds of winning the division.
It’ll be on management and the coaching staff to not only monitor and evaluate the team’s progress, but also address issues that come up as quickly as possible. Without those risk mitigation plans in place, a poor start can potentially derail a team’s championship aspirations.
The Edmonton Oilers are starting the regular season with a lot of uncertainty with their defensive group.
We know what to expect from Evan Bouchard, Mattias Ekholm and Brett Kulak. But Darnell Nurse is dealing with an injury from the playoff run and isn’t attending training camp. Ty Emberson and Troy Stecher have the potential to be regular options on the right side, which is lacking depth. But there’s no guarantees there. And then there’s Josh Brown, who I wouldn’t have high expectations for considering his on-ice numbers at even-strength, which have consistently been poor. I’m still not sure how he landed a three-year deal.
It remains to be seen how training camp shakes out and if any other players emerge as defensive options, including Travis Dermott, who is on a PTO and Max Wanner, who’s 21, shoots right, and has developed well in Bakersfield. For now, though, it’s the bets management has made and what they have heading into the season. And the Oilers will likely do what they can to accrue cap space and make enhancements to their blueline later in the season – depending of course, on how the current group performs.
Great to see the @EdmontonOilers key Management people and HC Kris Knoblauch all in Penticton.
Fully expect the Oilers to be in the market for a 2nd pairing RD…at some point… Preferably with a little term left…
If the Oilers do eventually pursue a right-hand defenceman who has term left, I’d suspect they would want someone with experience and someone they have a better handle on. The one name that’s come up a few times in the local market is Finnish defenceman Rasmus Ristolainen. Selected eighth overall in the 2013 entry draft, Ristolainen has played 713 NHL games for Buffalo and Philadelphia. Ristolainen turns 30 this fall and is in the third year of a five year contract he signed with Philadelphia in 2022 with an annual cap hit of $5.1 million.
To make the financials work, the Oilers would probably need Philadelphia to retain a good portion of Ristolainen’s contract, which would cost them extra assets. But before doing that, it’s worth looking at a few things, including Ristolainen’s usage over his career, his on-ice shot-share numbers at even-strength, and what his impacts are on the penalty kill (an area that the Oilers might need help with after the departures of Cody Ceci and Vincent Desharnais). All of this will give us a better sense around what kind of value someone like Ristolainen could bring to the Oilers.
Usage at five-on-five
Ristolainen entered the league in 2013 with high expectations and was given a lot of responsibility by the Buffalo Sabres. Management there had done a poor job at constructing the roster, and they didn’t have many options for the coaching staff. So, throughout his eight seasons in Buffalo, Ristolainen played some of the highest minutes in the league and in all situations, especially at even-strength.
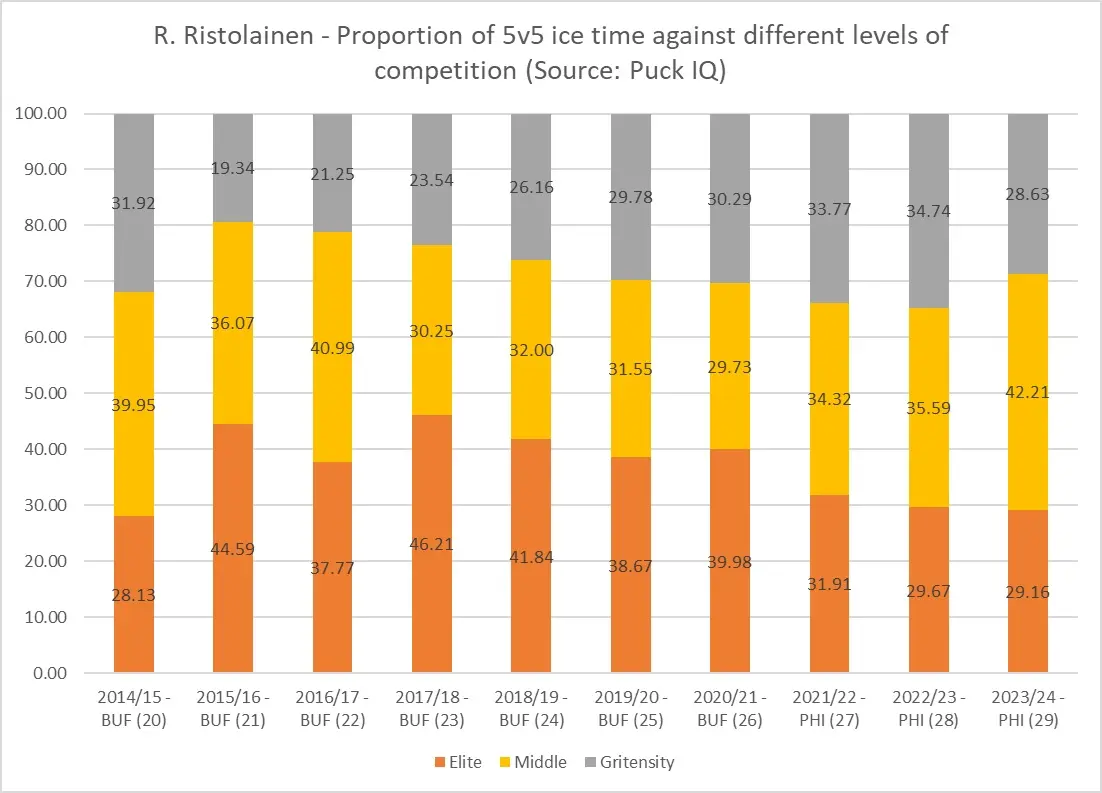
Below is the average number of even-strength minutes Ristolainen played by season, with his highest rate of minutes coming as a 22-year-old in 2016-17. Since then, his ice time has gradually declined, especially in his second and third years in Philadelphia, where he’s averaged just over 16 minutes a game. Last season, Ristolainen dealt with significant injuries and played only 31 games, which impacted his ice time. He underwent surgery for a ruptured triceps tendon in April and is expected to be fit to play this upcoming season.
What really stands out from Ristolainen’s time in Buffalo was the extreme amount of time he played against elite-level competition – well above 40 percent in some seasons. He was consistently given some of the highest proportions in the league among defencemen and didn’t fare too well. Again, the Sabres didn’t exactly surround him with good talent, and they missed the playoffs every year because of their shoddy decision-making, so he was typically the best and only option. Below is a breakdown of the competition levels Ristolainen faced using the methodology from PuckIQ.
Philadelphia appears to have recognized that Ristolainen was getting way too much responsibility in Buffalo and had a plan to put him in a position to succeed once they acquired him. In the last few seasons with the Flyers, we see that his proportion of ice time against elite competition has dropped to more reasonable levels – around 30 percent. This is where he probably should have been, considering that his on-ice numbers in Buffalo were so poor.
On-ice results at five-on-five
What this reduced responsibility in Philadelphia appears to have done is help improve Ristolainen’s on-ice shot-differential numbers. Playing so many minutes, and a lot of those minutes against elite competition, Ristolainen played a lot of time without the puck, and his numbers reflected that. The Sabres consistently struggled to outshoot and out chance opponents, and those numbers were even worse when Ristolainen was on the ice. Again, he didn’t have a lot of help on that team. Plus he was definitely in over his head with the assignments the coaching staff gave him.
Below are Ristolainen’s relative-to-team shot-differential numbers by season. I tend to use Corsi, a proxy for puck possession, and Fenwick and Expected goals as a proxy for scoring chances.
We see here that with Ristolainen on the ice, the Sabres fared much worse and saw their shot and chance differentials negatively impacted. Again, a lot has to do with his assignments. But it was painfully obvious that he shouldn’t have played all those minutes and needed fewer minutes and responsibility. When he got to Philadelphia, he did get a lot of minutes in his first season, but as we saw in the PuckIQ numbers, he was playing a lower proportion against elite-level players compared to previous years in Buffalo. What this did was help his on-ice shot-differential numbers, as we saw that the Flyers did better with him than without him. In his second season as a 28-year-old Flyer, his numbers dipped again, but that might have to do with the injuries he sustained and the fact that he’s aging and dealing with some wear and tear.
Penalty kill
Another area that Ristolainen has a lot of experience with is the penalty kill. He was regularly on the first unit in Buffalo, and that usage continued during his first two seasons with Philadelphia. What’s worth noting is that while in Buffalo, Ristolainen’s on-ice rate of shots against was quite high relative to his teammates and well above the normal levels for first-unit penalty kills. His numbers, however, have gradually improved since joining Philadelphia, so it might have been the system and linemates in Buffalo that could have been impacting his numbers. If, for whatever reason, the Oilers penalty kill struggles early on, expect Ristolainen’s name to come up more often in the market.
Thoughts
It’ll be interesting to see if we continue hearing about Ristolainen being a potential addition to the Oilers’ right side on the blue line. He’s got the experience and name recognition, and the term left on his current deal would be manageable. However, the Oilers will need to give up assets to have Philadelphia or another team retain part of the salary to make his contract fit. And that’s where the Oilers must determine what value Ristolainen brings and if it’s worth giving up those assets. From his recent numbers, there appears to be value as he can hold his own on a second pairing at even strength and can play on the penalty kill. The one concern with Ristolainen is health, how he recovers from the tricep surgery and if he can stay healthy.
There are a few different ways to evaluate the work Ken Holland did as the general manager of the Edmonton Oilers between 2019 and 2024. Actual results – like the win loss record, playoff success and number of banners – is a simple method. You can also look at how well the team drafted and developed players, how well they managed the team salary cap, and how efficient they were signing contracts and constructing the roster.
But because Connor McDavid is on the roster, I’ve always felt that a more accurate method of evaluating the general manager of the Edmonton Oilers is to look at the team’s performance and results without McDavid on the ice. McDavid is an elite-level talent that can elevate the play of his linemates, almost single-handedly drive the team’s overall results and, in turn, really mask the other deficiencies of the roster. The general manager doesn’t have much influence on McDavid’s play. Their only job really is to ensure that the roster has enough talent to outscore opponents (or at least not get caved in) when McDavid isn’t on the ice.
To evaluate Holland’s work as general manager of the Edmonton Oilers, I’m going to focus on the team’s even-strength (5v5) play without McDavid. Even-strength is the most common game-state and requires the full team’s involvement on offence and defence. And I’m also going to include the team’s playoff performances as Holland often used the trade deadline to add players.
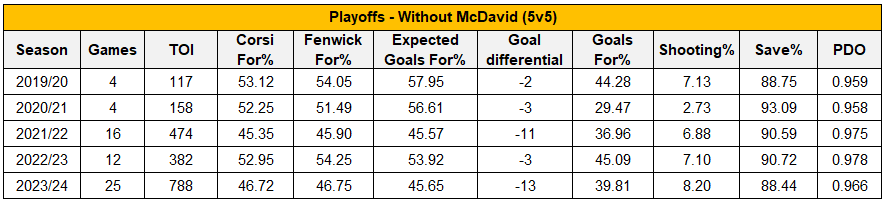
The tables below shows the Oilers team numbers without McDavid in each of the five regular seasons and playoff runs. The shot-share numbers like Corsi For, Fenwick For and Expected Goals For percentages gives a sense of how well the team performed and if they were able to control the flow of play and scoring chances. The Goal-differential and Goals For percentage reflects the team’s actual results. And the team save percentage and team shooting percentage captures the player-driven metrics.
In the first three regular seasons under Holland, the Oilers were dreadful without McDavid on the ice at even-strength. They were outscored consistently largely because they were playing more time without the puck and getting outshot and out-chanced. Despite Holland spending assets and signing plenty of players to help improve their depth, the Oilers posted an Expected Goals For percentage of 47% and were outscored 222-273 (a goal-differential of -52) without their captain over this three year period. Things did turn around in the last two regular seasons. The team had better results without McDavid – posting a +12 goal-differential in 2022/23 and +8 in 2023/24. These results were supported by solid shot-share numbers, indicating the results were real and sustainable. Should note that Holland’s first coaching hire was behind the bench for most of the three-year period when the depth players struggled. Woodcroft replaced Tippett in the latter part of the 2021/22 season and helped turn their season around.
The table below contains the same metrics as above, but for the five playoff runs.
While Holland did oversee the team’s even-strength turnaround in the regular season, the team’s playoff results without McDavid on the ice were consistently poor. In all five playoff runs, the Oilers were outscored when McDavid was on the bench, with this most recent playoff run being the worst. The Oilers posted a -13 goal-differential largely driven by a Corsi For percentage of 46 percent and an expected goals for percentage of 45 percent. If it wasn’t for McDavid’s play and the penalty kill, the Oilers even-strength play without McDavid probably would’ve led to an earlier exit. And when the team did post good shot-share numbers without McDavid for a few of the playoff runs, they were sunk by the lack of skill and finishing talent – as reflected by their below-average shooting percentages. And goaltending was consistently inconsistent.
The main takeaway from reviewing the regular season and playoff metrics without McDavid on the ice is that the Oilers failed to meet their true potential under Ken Holland’s management. He did a poor job evaluating talent and managing the salary cap in off-seasons and trade deadlines, and couldn’t build a good team around McDavid. The Oilers were often up against the cap because of a long list of poor signings he made and Holland often didn’t get enough value for the picks and prospects that he dealt away. And his mismanagement cost them dearly in the playoff runs.
In five years under Holland, the team secured a single banner – the western conference title in 2024. There were no championships, no President’s Trophy’s, and not even a single division title.
The expectations were high for Holland as the highest paid general manager, and with McDavid and Draisaitl under contract and in their primes for the full duration of his tenure. And the biggest driver for the Oilers lack of success is Holland’s inability to identify and acquire enough high-end talent. Holland was fairly active around trade deadlines and free agency and had plenty of opportunities to make a positive impact. He didn’t recognize the key underlying issues, didn’t manage the cap well, and made countless missteps when evaluating, trading and acquiring assets. A couple large mistakes and several small mistakes that added up to large mistakes – and across some critical positions on the roster.
Hopefully, the next general manager can avoid these types of mistakes and finally build a better roster around McDavid and compete for more banners. Including the championship one.
Incredible opportunity for the Edmonton Oilers heading into game seven of the championship finals against the Florida Panthers. It really could go either way, but it’s hard to imagine Edmonton losing with the star power they have up front, and the excellent results the team has posted since being down three games to none just ten days ago. Goaltending and depth scoring – often a spot of bother for the franchise – has been a major driver for the turn around. And it’s going to again be critical on Monday night.
The Oilers went from being outscored 7-3 at even-strength in the first three games of the series to outscoring the Panthers 10-5 in the next three games. A big reason for their success has been the contributions of their depth players. In the first three games, the Oilers didn’t have a lot going with McDavid on the ice, as the team barely outscored the Panthers 2-1. And without him, things were even worse as the club was outscored 1-6. But in the next three games, the depth scoring posted much better results as the team outscored Panthers 5-4. With McDavid on the ice, the Oilers excelled even more, outscoring the Panthers 5-1. The concern I would have is that the Panthers tend to control the flow of play and scoring chances when McDavid isn’t on the ice. So the team is running on a little luck.
The other driving factor has been goaltending. In the first three games, the Stuart Skinner posted an even-strength save percentage of only 88% – below league average and well below what Bobrovsky was posting (96%). But since then, Skinner has posted a much more respectable 91% save percentage, while the Panthers goaltending has posted a save percentage of 81%.
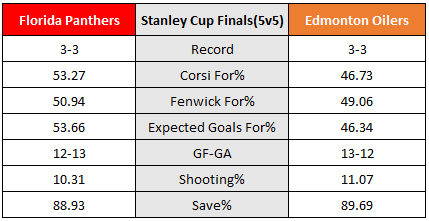
Below is a summary of how both teams have performed at even-strength over the six games, and what their results (i.e. goal differentials) have been like.
Worth noting that while the Florida Panthers have posted the better shot-share numbers, the Oilers have been much better when the score has been close. Of the 261 even-strength minutes played between these two teams, the score has been within one goal for 50% of the time. And in those minutes when the score has been within one goal, the Oilers have posted a Corsi For percentage of 49.73 percent and an Expected Goals for percentage of 50.92 percent. This is definitely a positive sign heading into game seven when we can expect the play to be tight and score to be close.
The one concern I would have is that while the results without McDavid have been better, the team is still spending a lot more time in their own zone. The Panthers tend to control the flow of play, and could potentially break out of their slump.
Whatever happens, it’s been an incredible season for the Edmonton Oilers. To be one win away from a championship is rare, and it reflects how strong the top players have been and the positive contributions from across the roster and at different games states. There’s of course some luck involved, and breaks along the way. But none of that gets inscribed on the cup.
Here’s to the journey, to the players who got the team here and the market that’s supported them along the way.
Even though the Oilers are down 3-1 in their series against the Florida Panthers, the Oilers are doing a lot of things right. And giving hope to a market that the series could go to seven games. Games are won and lost by the smallest of margins in the post-season, and it’s critical that the team maintain it’s performance at even-strength and the penalty kill.
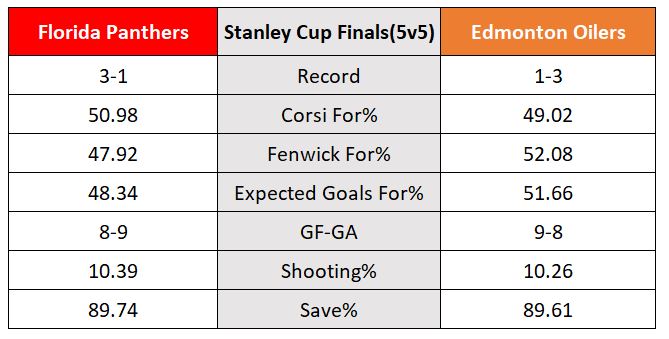
Here’s how the two teams have compared at even-strength (5v5) over the first four games. The Oilers have outscored the Panthers 9-8 in this game state, which is about 71% of the total minutes. If you factor in the other even-strength game-states (3v3 and 4v4), the Panthers have a slight edge in goals (11-10). In all situations, each team has twelve goals, including a shorthanded goal for the Oilers. The results are pretty darn close, and indicates that the series should be tied. But that’s how playoff hockey goes.
While the Panthers have a slight edge when it comes to controlling the flow of play, the Oilers are doing a better job at creating scoring chances, as reflected by their Fenwick For percentage and Expected Goals For percentage. After getting a thrashing in game four in Edmonton, Bobrovky’s save percentage is now below 90.00 percent and barely better than Skinner’s. Bobrovsky played a lot of minutes during the regular season, similar to Skinner, so I do wonder if fatigue is setting in.
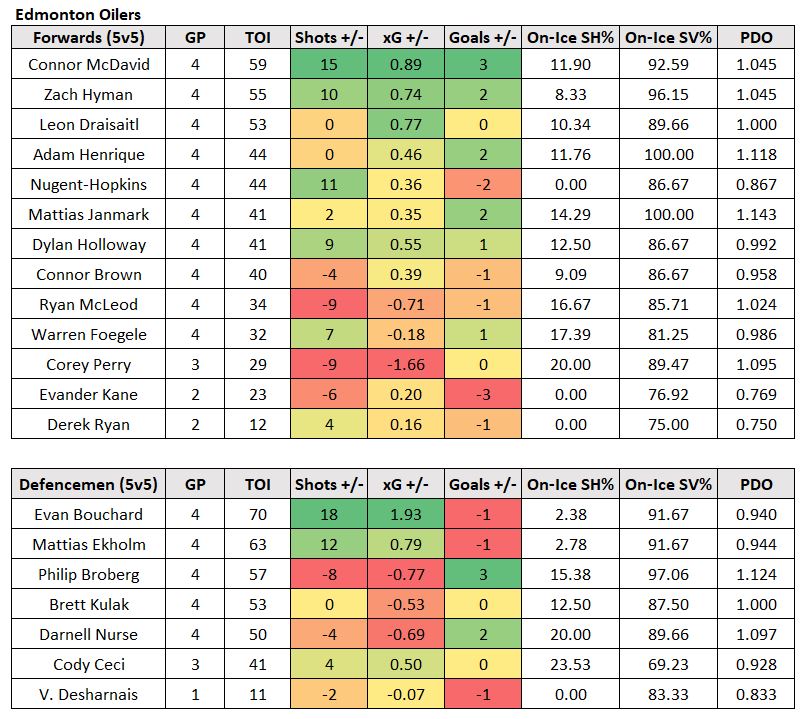
Below is an overview of how the Oilers and Panthers have performed this series at even-strength (5v5), as as well as their actual on-ice results.
The Oilers line featuring McDavid and Hyman continues to be a significant driver for the club, and should never really be counted out. The top defence pair of Bouchard and Ekholm are due for a little market correction as the Oilers see a bump in their performance numbers with them on the ice. But the results haven’t aligned quite yet because of their on-ice shooting percentage. Considering they spend a lot of time with the top players and had a lot of success together prior to this series, it’s fair to expect their results to improve.
Also noticed that Broberg has played the third most minutes at even-strength this series, which says a lot about the trust the coaching staff has in this player. And how his style of play and ability to make plays under pressure is well suited to counteract with the Panthers style. Should note that even in all situations, Broberg ranks third in ice time among defencemen as he’s taken Nurse’s minutes on the penalty kill and thriving in that situation. It’s a small sample size for now, but the Oilers are allowing the lowest rate of shots against with Broberg on the ice when shorthanded, and he’s a big reason why the penalty kill is doing so well this series.
The Oilers depth players, including guys like McLeod, Kane, Perry and Brown, are struggling and are going to be a focus of attention if the Oilers lose the series. After four games, the Oilers are posting a +3 goal differential (5-2) with McDavid on the ice, thanks to an on-ice Corsi For percentage and Expected Goals For percentage of 56%. Without McDavid, the Oilers have posted a -2 goal differential (4-6). And that’s largely driven by their Corsi For percentage of 44% and an Expected Goals for percentage of 48%. To get out of the hole they’re in, the Oilers need their depth guys to be a factor. And that includes their second line with Draisaitl, who looks like he’s dealing with an injury.
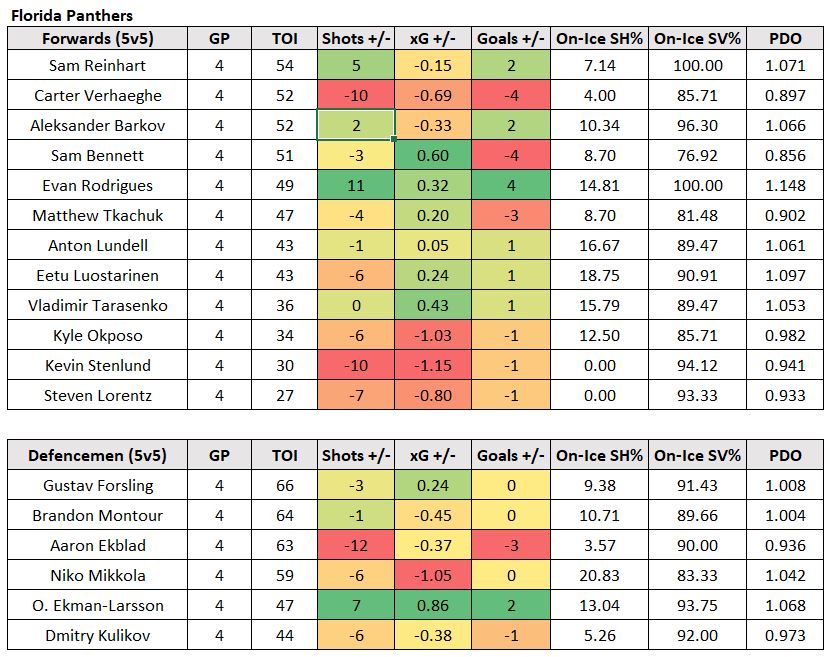
Below is how the Panthers skaters have performed in this series.
Have to say, the top end players in Florida haven’t been very impressive. Bennett, Verhaeghe and Tkachuk are all posting negative shot differentials and goal differentials, and aren’t driving things like the Oilers top players have. Having said that, their PDO levels are quite low right now, so there might be a bounce back game coming for some of them. Of all of the players we hear about, it’s actually been Rodrigues that’s had a great series so far. Team tends to out-shoot and out-chance the Oilers at even-strength with him on the ice, and he’s posted a +4 on ice goal differential (the highest among both teams).
The Oilers and Panthers special teams are basically cancelling each other out, as both powerplays have scored only once this series. Both teams did an excellent job at suppressing shots and chances on the penalty kill during the regular season and in the first three rounds of the post-season. So this isn’t completely surprising. It’s really going to come down to goaltending on the penalty kill, and which netminder will maintain their level of play. Both goalies posted similar numbers in the regular season, and played significant minutes. Among the 59 goalies who played at least 100 minutes on the penalty kill during the regular season, Bobrovsky ranked 19th with an 87.50 percent save percentage playing the most minutes in the league. And Skinner ranked 40th with an 85.40 percent save percentage and played the fourth highest number of minutes.
Because the Oilers are posting good underlying numbers at even-strength and have their top line and top pairing in good form, they definitely have a shot at pushing this series to seven games. It’s really going to come down to the Oilers goaltending, and if Skinner can post league-average numbers. And getting scoring from lines two to four at even-strength. Both have been areas of weakness throughout the playoffs, but can easily turn around based on the success they had in the regular season. Combine that potential bounce back with a few goals on the powerplay, and the Oilers should make this a more competitive series.
Joined guest host Doug Dirks on CBC Alberta at Noon along with Dave Waddell from CBC Calgary to talk about the Edmonton Oilers, their playoff run and the first game at home in the finals. It was a great interactive show as we talked a lot about hockey, but also heard from a number of listeners about their personal experiences during the playoffs. Full segment is here: CBC Alberta at Noon (2024, June 13)
Topics we covered:
What went wrong in games one and two in Florida, and what the key factors were.
The general environment around this team, and why there’s plenty of optimism that the Oilers will bounce back.
The play of Stuart Skinner, the pressure he’s in, and what to expect from him.
The pressure around the Edmonton Oilers to win a championship, and the urgency fans are feeling.
The officiating during the playoffs, and the frustration fans are experiencing.
Thanks to the CBC team for putting it all together!
It’s been a poor start for the Edmonton Oilers in their championship series against the Florida Panthers. After the first two games, they’ve been outscored 7-1 in all situations, with their only goal being scored by Matias Ekholm at four-on-four in game two. At even-strength (5v5), the Panthers have outscored the Oilers 4-0 so far, and have a powerplay goal on top of that. Their other two goals have been on an empty net.
The Oilers inability to score at even-strength (5v5) is definitely surprising considering the talent they have on the roster and the success they’ve had during the regular season. They finished first in the league in shots per hour with 32.87 and third in goals per hour with 2.90. Unfortunately, this level of production hasn’t carried over to the post-season, which isn’t surprising. We know teams ramp up their defensive play and intensity in the playoffs, and the Oilers are 20 games into a long playoff run. At this point, the Oilers are generating 25.92 shot per hour and have scored at a rate of 2.36 goals per hour. Against Florida, the Oilers are so far generating 25.44 shots per hour and zero goals.
Edmonton Oilers (5v5)
Shots per hour
Goals per hour
Shooting%
vs Los Angeles
26.08
2.92
11.21
vs Vancouver
27.39
2.86
10.46
vs Dallas
23.88
2.02
8.46
Above is a quick snapshot of how the Oilers performed in the previous three rounds of the playoffs. What stands out is that as the Oilers have progressed deeper into the playoffs, their rate of shots per hour and their team shooting percentage has gradually declined. Against Los Angeles, they posted a shooting percentage of 11.21 percent, well above their regular season shooting percentage of 8.81 percent. But against Dallas, it slipped to 8.46 percent, and was part of the reason why they were outscored by Dallas at even-strength.
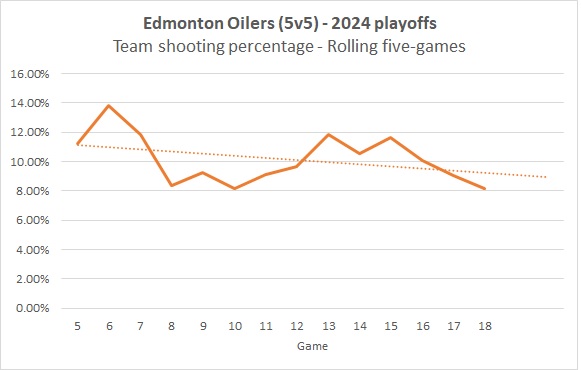
Breaking out the Oilers team’s shooting percentage over rolling five-games, we see that heading into the series against Florida, they were definitely in a downward trend. It still doesn’t explain not being able to score a single even-strength (5v5) goal. But it does indicate that the Oilers are hitting a wall, especially when McDavid isn’t on the ice.
Edmonton Oilers (5v5)
Shooting% with McDavid
Shooting% without McDavid
vs Los Angeles
14.63
9.09
vs Vancouver
12.70
8.89
vs Dallas
11.48
5.80
The Oilers performance and results without their captain at 5v5 this post-season has flown under the radar a bit as the power play and penalty kill has been bailing the team out. In the first three rounds of the playoffs, the Oilers have been outscored 18-26 without McDavid, a goal-share of only 40.91 percent. This is largely driven by the fact that their Corsi For percentage has been 45.81 percent and their Expected Goals for percentage has been 44.82 percent. Combine this with their poor shooting percentage, especially in the last round against Dallas, and it’s no surprise that McDavid is being relied on to carry the load again. Goal-scoring from depth players is critical in the post-season, and really needed to be addressed at the trade deadline when there were options available.
One last thought, this one on the Oilers powerplay. The Panthers have done a really nice job limiting the Oilers shots and scoring chances. In the two games so far, the Oilers have only generated seven shots on goal in 13 powerplay minutes (31.19 shots per hour), which is wild considering they generated 79.66 shots per hour in the previous three rounds and 62.33 per hour in the regular season. When the Oilers have had trouble scoring with the man-advantage in the past, it was easy to stay optimistic because they’d still be generating lots of shots and scoring chances. So you knew it was a matter of time before the results came around. That doesn’t appear to be the case any more. Which makes solving their even-strength issues even more critical.
Got to talk Oilers with @jessica_talks on CBC Radio Active this afternoon. Covered the lack of offence in the first two games, what the Oilers need to address and reasons for optimism.https://t.co/v8Mq8drLSs
The Edmonton Oilers special teams have kept the championship drive alive. The question now is if we can expect it to continue having success against the Florida Panthers.
One of the Edmonton Oilers’ major drivers for success this post-season has been their powerplay and penalty kill, which have produced outstanding results.
It’s been a factor in all three playoff rounds so far, as the Oilers have struggled to outscore opponents at even-strength, having only posted a +1 goal-differential over their 18 playoff games. They broke even in terms of goal-differential against the Los Angeles Kings, went +2 against the Vancouver Canucks and were a -1 against the Dallas Stars.
It’s really been the Oilers’ performance without McDavid’s line on the ice that’s caused these poor even-strength results. The team tends to get outshot and out-chanced consistently (46.54 percent expected goals for percentage), resulting in a -8 goal differential without their captain’s line and a +9 goal differential with him. The team, especially the depth players, are having issues converting on their chances at even-strength. And goaltending ranks as one of the worst among playoff teams in terms of save percentage and goals-saved above average.
Make no mistake, the special teams – featuring the top-end players and a lot of the depth players who are struggling at even-strength – have bailed this team out. And it’s hard to imagine the Oilers making it this far without the power play and penalty kill performing so well.
Powerplay
The Oilers have scored 19 power play goals in just under 74 minutes this post-season, a rate of 15.44 goals per hour. That’s one of the highest team rates in playoff history and isn’t even a level that the Oilers were running at during their regular season. The table below shows the Oilers’ regular season goal-scoring rate over rolling 18-game segments, with a blue line representing their current playoff scoring rate.
The Oilers’ results appear to be sustainable considering their skaters’ talent and overall health. Their current team shooting percentage of 19.39 percent is high, but this group was able to post a very similar rate over the full 2022/23 regular season – so it’s not totally out of the realm of possibility. Plus the group is currently generating 76.66 shots per hour, again one of the highest rates in playoff history and well ahead of the rest of the post-season teams.
It’s worth noting that the Florida Panthers have the potential to slow the Oilers power play down in this upcoming series. Their penalty kill has only allowed six goals in 85 minutes this post-season, a rate of 4.20 goals per hour that is second lowest among playoff teams – only behind Edmonton. The Panthers’ success is largely driven by their ability to prevent shots and chances, as their rate of 44.08 shots against per hour is the third-lowest in the league. And their goaltending save percentage ranks third best in the league. This post-season success appears to have carried over from their regular season. The Panthers finished with the fourth-lowest rate of shots against per hour (46.64) and the sixth-lowest rate of goals against per hour in the league (6.16).
Penalty kill
It’s remarkable how great the Oilers’ penalty kill has been this post-season, having shut down Los Angeles, who scored the 10th-highest rate of powerplay goals in the regular season, and Dallas, who scored the fifth-highest rate of powerplay goals in the regular season. The last power play goal the Oilers allowed was in game three against Vancouver on May 12th. In the ten games since, they’ve allowed zero.
A big reason for their success has been their ability to suppress offensive chances, as the club has allowed the second-lowest rate of shots against (39.87) among playoff teams. This strong defensive play in front of their goaltender is something that’s carried over from the regular season when the Oilers allowed the sixth-lowest rate of shots against (49.27 per hour). So it’s reasonable to expect the penalty kill success to continue, depending of course on if the goaltending can hold up. When shorthanded during the regular season, the Oilers team save percentage was the sixth worst in the league (84.68 percent). But it’s currently sitting at 94.92 percent in the playoffs, so there’s the possibility of some regression in the upcoming round.
The Panthers’ powerplay is generating plenty of chances this post-season, ranking third in terms of shots per hour (57.84). And it’s a carryover from the regular season when they finished with the second highest rate of shots per hour in the league. But they’ve had trouble converting on their chances during their playoff run, likely due to playing against some pretty elite goaltending. Tampa Bay, New York and Boston all finished top-five league wide when it came to shorthanded save percentage during the regular season. This has resulted in the Panthers’ powerplay scoring at a rate of 8.18 goals per hour, which is closer to league-average levels. Considering all this, it’s even more critical that the Oilers penalty killers continue to play strongly in front of Skinner, who, as mentioned above, could be at risk of some regression.
Hockey analytics is doing some pretty remarkable stuff for the game. Not only are there new methods of understanding and following the game, but we’re beginning to see some of the more unintended consequences of its growth.
One thing to keep an eye on will be the evolution of hockey reporting and journalism. Analytics has received widespread attention this summer with NHL teams hiring experienced professionals and discussing the new statistics quite publicly. All of this is great, but now the people following the game, especially those that are relatively new to hockey analytics, will demand supporting evidence, in an easy-to-use, storytelling format.
Travis Yost brought up an excellent point, citing the potential for new data tracking technology as a reason why the demand for better sports writing will likely grow. There will definitely be teams looking to hire individuals with experience in analytics to keep up, but there will also be media outlets looking to enhance their coverage of the game and these advanced stats.
I'm still not convinced there's been a huge change in acceptance of analytics though. I think the big change is in how many hires hit media.
This will put the onus on anyone developing information about the game, whether it be newspaper writers, hockey analysts on television and fans online. The game has changed because of analytics, and now the information surrounding the game has to evolve.
What this means is that the distribution of information has to shift from simple reporting to more data journalism. It won’t just be about grabbing quotes from coaches and players and then referencing some of the new stats like Corsi and Fenwick etc. But it’ll also mean having to embed graphics and information in an interactive and engaging way to tell a unique story.
The good news is, there are a handful of newspaper writers and bloggers who have been doing this very well for a few years now. James Mirtle of the Globe and Mail, as well as Japers’ Rink and SB Nation’s Outnumbered come to mind. But now, there will be an increasing demand for it. And I can definitely see some slick new platforms or reporting dashboards that can take all of the advanced stats and put together a strong game story.
Blogging platforms have served as a solid foundation and medium to develop hockey analytics. And now, they can be a real training ground for those looking to advance their careers in writing about the growing field.