 Establishing some simple targets for the Edmonton Oilers if they want to be considered a top end team.
It’s going to be a unique situation with the season kicking off on January 13th with 56 intra-division regular season games spanning over 16 weeks. Coaching staffs are going to have to be creative with practice schedules, recovery time and roster management as there won’t be much time between games. And training camp starts in less than two weeks. Wild.
Now the main goal for the Oilers is to finish in the top four of their division and secure a playoff spot. That means they should be targeting a 0.600 points percentage – the total points accumulated divided by the points that were available, including extra time. This is what the top ten regular season teams in the league typically reach every year and are often considered as legitimate contenders. The Oilers were close to this level last season, finishing with a 0.585 points percentage, good for 12th in the league. The one time they made the playoffs in the last 14 seasons they had finished the regular season with a 0.628 points percentage.
With a 0.600 points percentage goal in mind, we can start to identify some key performance indicators (KPI’s) that we can measure the Oilers against. This would include not only the actual results like goals for and against, which of course determines how many points a team has in the standings. But also shot-based metrics, which can measure how well a team is doing at out-shooting and out-chancing opponents. Controlling the flow of play and spending time in the offensive zone is what teams are trying to do and what leads to better results, so we can use the publicly available shots data as a proxy. It’s important to monitor this info as part of the overall evaluation of a club as it can tell us if the actual results (i.e., goals for and against, and accumulated point totals) are sustainable or not.
Below are the KPI’s I’ll be using for even-strength play (5v5), with a brief description for each.
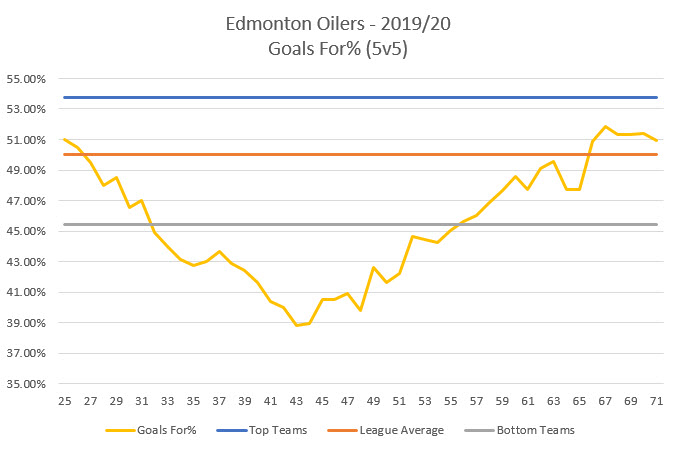
- Goals For percentage (GF%) – The proportion of all the goals that the team scored and allowed that the team generated (i.e., Goals For/(Goals For + Goals Against).
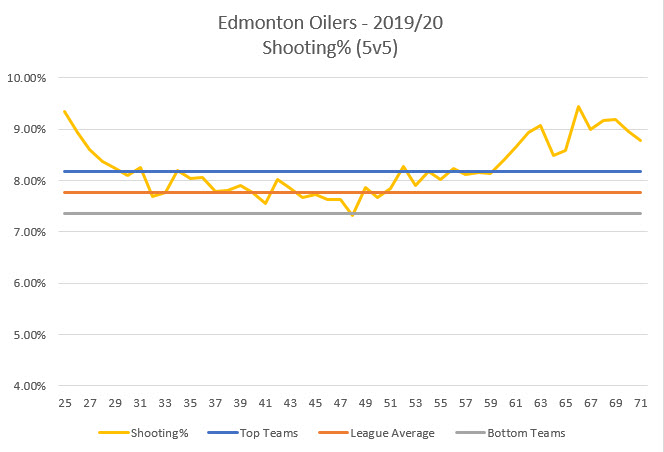
- Shooting percentage (SH%) – The percentage of the team’s shots on goal that became goals.
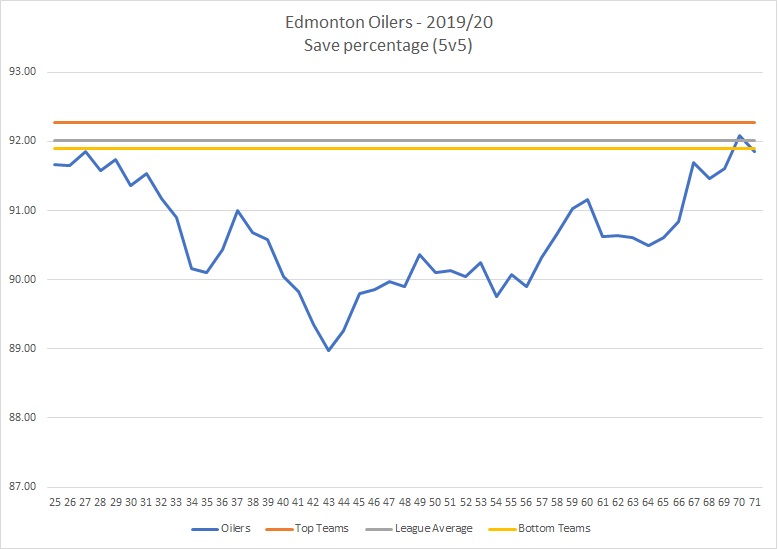
- Save percentage (SV%) – The percentage of the team’s shots on goal against that were saved.
- Corsi For percentage (CF%) – The proportion of all the shot attempts the team generated and allowed that the team generated. This is used as a proxy for possession and can predict a team’s future share of goals (GF%).
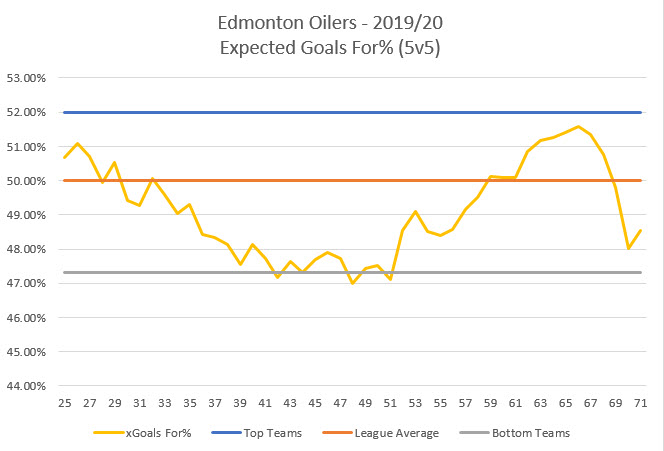
- Expected Goals For percentage (xGF%): Measures the quality of the unblocked shots taken, and assigns a value to it depending on the probability of it becoming a goal. Key variables include the type of shot taken, where it was taken from and compares it to historical shot and goal data to determine the value. (Natural Stat Trick)
Now it’s a pretty straight-forward exercise to set the actual values for the identified KPI’s. What I did was look at the last three regular seasons, zeroed in on the teams who finished their seasons with a points percentage above 0.600 and then calculated the group’s averages for each metric. For context and to measure how well the Oilers are doing relative to past teams, I also calculated the league average rate for each metric as well as the average rate for teams that finished in the bottom third of the league.
Let’s start with goal-scoring rates for and against, and the overall goal-share.
| Metric | Top Teams | League Average | Bottom Teams |
| Goals For/60 | 2.67 | 2.45 | 2.27 |
| Goals Against/60 | 2.31 | 2.45 | 2.59 |
| Goals For% | 53.58 | 50.01 | 46.72 |
At minimum, the Oilers cannot be getting outscored at even-strength and posting a goal-share of less than 50% – that much should be obvious. But we get a much more specific goal-share that the Oilers should be targeting based on what top level teams have posted in the past. The Oilers should be targeting a rate of 2.67 goals per 60 to be in that upper end category, and at minimum allowing less than 2.45 goals against per 60.
This of course is going to be determined by player-driven-outcomes – how well players are finishing their scoring opportunities and how well the goaltending holds up. Top teams on average post a shooting percentage of 8.46% at even-strength and a save percentage of 92.28%. Note that the difference between top teams and bottom teams when it comes to these player-driven-outcomes are pretty razor thin.
| Metric | Top Teams | League Average | Bottom Teams |
| Shooting% | 8.46 | 7.99 | 7.60 |
| Save% | 92.28 | 92.02 | 91.90 |
The question worth asking at this point is can the Oilers reach the goal-share level of a top team this upcoming season. They finished the 2019/20 regular season with a goal-share of 47.32%, ranking 25th in the league only ahead of the California teams, Ottawa, New Jersey and Detroit. The good news is that they were trending upwards to finish the season, posting a goal-share of 50.93% over their final twenty-five games.
Now finishing chances didn’t appear to the be the issue last season, as the Oilers posted a shooting percentage of 8.43%, which is closer to what top end teams post. The problem was that they didn’t generate enough chances, ranking 27th in the league with 52.64 shot attempts per hour, and ranking 21st in the league with 2.24 expected goals per hour.
The other major issue was the goaltending at even-strength, which ranked 25th in the league last season at 91.23%. It did gradually improve over the course of the season, but it cost them games and points in the standings especially early on in the season. The Oilers knew about this issue, and while they did pursue some of the higher end goalies in the off-season, the best they could do was bring back Mike Smith – one of the worst goalies in the league last season. In a shortened season with less time to make up ground, goaltending has to be, at minimum, league average.
Considering that goaltending might be a weak spot, the Oilers will need to figure out how to control the flow of play as measured by Corsi For% and spend more of their time in the offensive zone. Similar to above, I’ve calculated the averages that top teams have posted, along with the averages for bottom teams and league-average teams for context. I’ve also added the targets when it comes to expected goals, which measure the quality of the shots taken, and assigns a value to it depending on the probability of it becoming a goal.
| Metric | Top Teams | League Average | Bottom Teams |
| Corsi For/60 | 58.41 | 56.37 | 54.68 |
| Corsi Against/60 | 54.29 | 56.37 | 58.50 |
| Corsi For% | 51.84 | 49.99 | 48.29 |
| Metric | Top Teams | League Average | Bottom Teams |
| Expected Goals For/60 | 2.37 | 2.29 | 2.19 |
| Expected Goals Against/60 | 2.21 | 2.29 | 2.39 |
| Expected Goals For% | 51.72 | 50.01 | 47.86 |
Reaching the Corsi and Expected Goal levels posted by previous top-level teams will help to off-set the Oilers weakness in net and potentially increase their chances of winning games. It’ll definitely be a challenge for the coaching staff as they have the high end talent that needs to take some risks to create scoring chances, but there’s not enough defensive skill on the roster that the coaches can spread across the lineup.
Lots to track this upcoming season and plenty more analysis to be done within each metric. For instance we may find that the Oilers team performance may be impacted by specific parts of the roster like the bottom six forwards or maybe a defence pairing that’s in over its head. Whatever the case may be, the Oilers have to be monitoring basic indicators like this and hopefully more. During the course of the season, the coaching staff and management should be mindful of whether the results, whether it positive or negative, are real and sustainable. And management needs to make changes to the roster as needed, with an eye on the long-term goal of contending for championships.
Data: Natural Stat Trick
Also posted at The Copper & Blue.


 My guest this week is Scott Powers, senior writer for