Typically wait until after game four before doing a check-in on a series, but there’s currently some pretty pressing issues for the Edmonton Oilers.
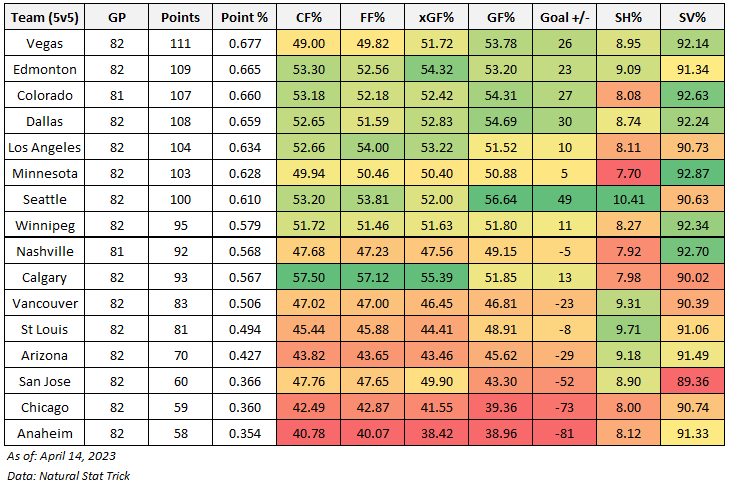
The club is currently trailing in the second round against the Vegas Golden Knights, who have a done a pretty solid job keeping the Oilers shots and scoring chances to a minimum at even-strength (5v5). After three games, the Oilers have posted a Corsi For percentage of 51.67% , but an Expected Goals For percentage less than 45% – second worst among the second-round playoff teams. And that’s a big reason why they’ve been outscored 4-9, and have the worst goal-share in this group of eight (30.77%).
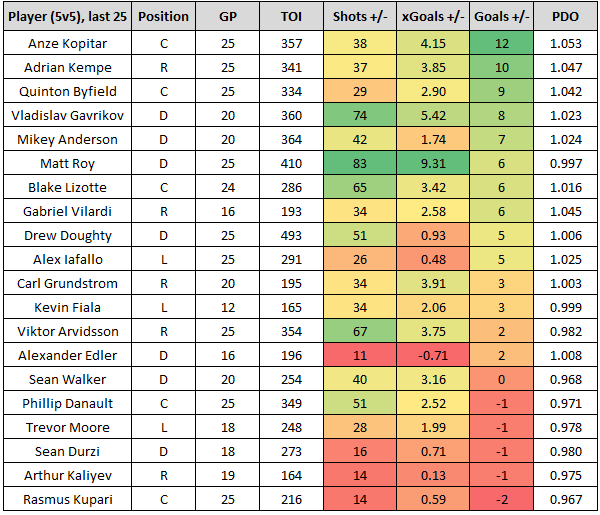
What’s even more alarming is how the Oilers have performed without McDavid or Draisaitl on the ice at even-strength, which is about 55% of the team’s total ice time. They’ve been outscored 1-5, driven largely by their expected goal-share of 39%. That’s a big drop off from the first round, when the Oilers took advantage of a Kings roster that lacked significant depth. If these results continue, the Oilers may need to separate McDavid and Draisaitl more often, which would reduce the team’s ice time without one of their stars down to around 30-35%.
What Vegas has done really well in this series is not just limit the overall chances against. But when they do allow shots at even-strength, they’re often from the sticks of Oilers defencemen, which are typically from low probability scoring areas. Compared to the regular season, and especially the first round, the Oilers forwards are getting a lower proportion of the shots on goal, which the Vegas coaching staff has to be thrilled about considering the talent level up front that they’re slowing down.
In the 2022/23 regular season, the Oilers as a group generated 2,090 shots on goal at even-strength, with 68.7% coming from the sticks of forwards. That’s pretty close to the league average of 70.1%. Against the Kings, the share of shots from forwards was 72.8% as the Oilers did a really good job controlling the flow of play and generating higher quality chances.
Vegas seems to have figured something out, as the Oilers as a whole have only generated 63 even-strength shots in the first three games – a rate of 27.17 per hour which ranks seventh among the eight second-round playoff teams. Compare that to their numbers against Los Angeles, when the Oilers generated the second highest rate of shots with 34.19. And in the regular season, the Oilers ranked 9th in the league with 31.83.
Of the 63 shots the Oilers have been able to muster against Vegas, 42 have been from forwards – a share of 66.7%. In their game one loss, the Oilers forwards took 57.1% of their teams total shots. And in the game three loss, they took 61.5% of the team’s total shots. In the game they won, the Oilers forwards had a much higher proportion of shots, something the club really needs to replicate to improve their odds of winning games. The table below breaks down the proportion of shots from the forwards by game, with the orange line representing the Oilers regular season average.

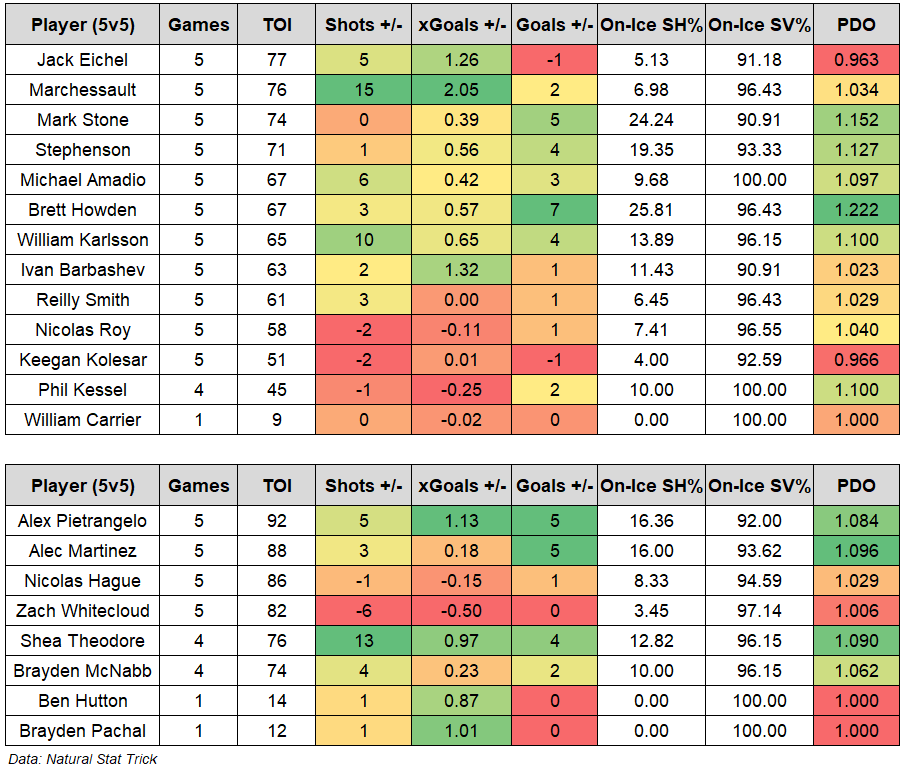
So far in this second round, defenceman Darnell Nurse is currently tied for first on the team in shots with seven (8.49 shots per hour), something Vegas has to be happy with. Nurse only had eight shots total in the Oilers six-game series against the Kings, a rate of 4.09 shots per hour – half of what he’s producing in the current series. In the regular season, his rate of shots per hour was 6.50 per hour. For whatever reason, Nurse is shooting more which is going to be a problem considering he hasn’t been a significant scoring threat; his personal shooting percentage was 4.50% this season.
If the Oilers want to improve their odds of winning games against Vegas, they need to do a better job of creating scoring chances at even-strength. Something that won’t get done if the offence continues flowing through the blueline. Hopefully the coaching staff is aware of this and can make adjustments – either tactical or deployment. If not, they’ll need to rely heavily on the powerplay to bail out their failures at even-strength.
Data: Natural Stat Trick
Related:
- The Edmonton Oilers v. The Vegas Golden Knights: A Tactical Preview – Oilers Nation (2023, May 2)
- Previewing the Oilers vs Golden Knights (2023) – The SuperFan (2023, May 2)