Dom Luszczyszyn wrote a great piece at the The Athletic where he looked at the impact the star players have on their team’s playoff success and the impact depth players have. Using extensive metrics, what he found was that while depth players are important, it’s the top end players that drive success for a team.
Hockey may be the ultimate team game where every role, player and role player matters. But within that dynamic, there’s an opposing truth that they only matter as much as the players at the top of the hierarchy dictate.
Even in the playoffs, like it or not, it’s how bright the stars shine that decides who wins and who loses.
The Athletic
This article made me think about the western conference and how the Oilers compare with the other seven teams who are currently in a playoff spot. Specifically, I wanted to know how the Oilers top players compare with the other teams during even-strength play, as well as how the Oilers depth players compare.
To do this analysis, I took the forward with the highest ice-time at even-strength and used their on-ice numbers this season as a proxy for the team’s top line, which always features one or two of the team’s higher-end forwards. I then looked at how each team has performed without their top forward to evaluate the team’s depth. Below are the forwards from each team that were used in this analysis. Note that some players with the highest ice time may not be their team’s best player, but they do often play with the team’s higher end forwards. For example, Chandler Stephenson’s most common linemate in Vegas this season has been Mark Stone, while Mats Zuccarello’s most common linemate in Minnesota has been Kirill Kaprizov.
- Vegas – Chandler Stephenson
- Los Angeles – Anze Kopitar
- Colorado – Mikko Rantanen
- Dallas – Jason Robertson
- Minnesota – Mats Zuccarello
- Edmonton – Connor McDavid
- Seattle – Yanni Gourde
- Winnipeg – Mark Scheifele
First a look at how the team’s in the west compare with one another when their top players are on the ice at even-strength. Included in the table below is each team’s even-strength performance numbers (i.e., shot-share metrics that measure how well a team controls the flow of play and the total chances) as well as each team’s goal-share and goal-differential. I’ve applied a simple heat map to each metric to show how each club compares to the rest of the western conference. The table is sorted based on the team’s current points percentage.
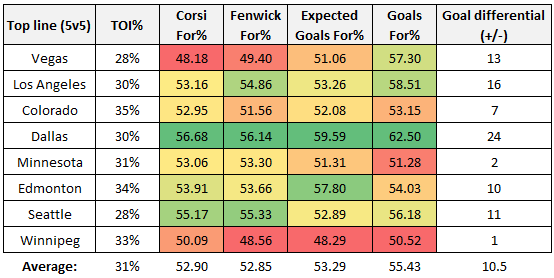
If it’s a team’s top end talent that drives results in the playoffs, the Oilers appear to be in pretty good shape. While their goal-share is slightly lower than this group’s average, the Oilers top line has consistently been a handful for opponents controlling over 53% of the shot attempts when they’re on the ice and just under 58% of the expected goals (which factors in shot quality). Dallas, however, appears to be the team to beat as their top line has had the best results supported by the highest share of shots and scoring chances.
And here’s how the depth of each team compares with one another; again this is without their top line on the ice at even-strength. It’s important to note that this depth is going to contain some of the higher end forwards as well, which will impact the team’s success going forward.
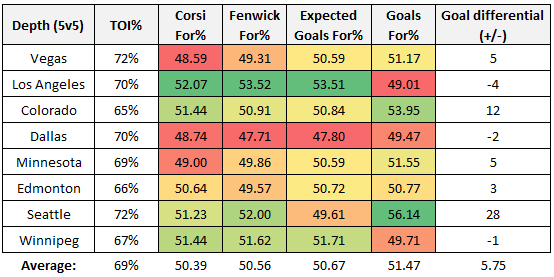
Here the Oilers depth ranks around the group’s average levels, posting around a +3 goal differential and a shot-shares also at the break-even mark. Los Angeles’ depth, while having poor results relative to the other teams, has been more difficult to play against posting shot-share numbers closers to 53%. Colorado’s depth looks pretty good here too. They just need their top-end forwards to get and stay healthy, and they’re probably going to be a handful. Seattle has nice balance across their roster too, just need goaltending to not lose them games. The problem for them is they lack the least number of star players, according to Dom’s model. Edmonton and Colorado have the most star players (7) among western conference playoff teams, which is probably why they currently have the highest probability of making it to the western conference finals.
It’ll be worth taking a look at these numbers again prior to the playoffs, maybe with a focus on the more recent 25 games or so.
Data: Natural Stat Trick

Pingback: Tracking the Western conference – As of April 14, 2023 | The SuperFan