Things to Consider Before Splitting up the Second Line

The line of Ryan Nugent-Hopkins, Jordan Eberle and Milan Lucic is taking some heat because of their lack of production, especially at even-strength (5v5). Over the nine games this post-season, Lucic and Eberle each have an assist, while Nugent-Hopkins has not registered any points at even-strength. As a trio, their on-ice goal-share is 25%, as they’ve been on the ice for one goal-for and three goals against. But before splitting them up, there are a couple things to consider.

  1. The trio have played the most minutes together this post-season for the Oilers (85.37 minutes) and have often been out against the other team’s top lines.
  2. In the previous series, they played the most minutes against Pavelski and Thornton. Currently, they’re playing the majority of their minutes against Ryan Getzlaf.
  3. There have been 45 different line combinations across the league this post-season that have played at least 30 minutes together. Among the 45, the trio rank 7th in terms of adjusted Corsi For% and Fenwick For%. They rank 13th when it comes to Expected Goals.
Metric (5v5) Share Rank
Corsi For% 58.40% 7th
Fenwick For% 59.08% 7th
Expected Goals For% 55.83% 13th


4. The underlying numbers they have posted together in the playoffs are consistent with their numbers from the regular season. Over 330 minutes, the second most on the Oilers, they finished the year with a goal-share of 50.0%.

5. The Oilers as a team have the following numbers this post-season: Corsi For% – 49.92%, Fenwick For% – 47.55% , Expected Goals For% – 48.06% , Goals For% – 42.86% (12 goals for, 16 goals against). The club overall is a better team when RNH, Eberle and Lucic are on the ice together. Their relative-to-team stats are solid.

Line TOI CF% FF% xGF% GF/GA
Lucic-RNH-Eberle 85.37 57.65 58.47 55.13 1-3
Maroon-McDavid-Draisaitl 57.60 48.82 41.38 43.53 4-2
Caggiula-McDavid-Draisaitl 33.15 58.23 54.55 66.22 1-0
Caggiula-Letestu-Kassian 44.64 40.00 39.39 37.35 0-1
Pouliot-Desharnais-Slepyshev 46.43 46.51 50.00 53.82 2-0

6. When RNH, Eberle and Lucic are on the ice together, the team has a penalty differential of +4, which is the best differential among the 45 different line combinations. The team has drawn 5, Eberle himself has drawn 3, and taken 1. Only three line combinations have not been on the ice for a penalty against their team. The Oilers powerplay is good and needs to get as many opportunities as possible.

7. This line is above average when it comes to generating shot attempts and unblocked shot attempts (per 60), ranking 13th among the different line combinations this post-season.

8. This line is above average when it comes to suppressing shot attempts and unblocked shot attempts (per 60), ranking near the top 10.

9. RNH, Eberle and Lucic finished the season with a shooting percentage of 6.13%. They’re currently at 2.13%.

Data: Corsica Hockey, Natural Stat Trick

Full article is at The Copper & Blue.
Thoughts on the Oilers/Ducks series: Shots, goaltending, line combinations and penalty differentials

Playoffs have been a lot of fun so far. Couple notes.

Over their nine post-season games, the Oilers have been outscored 16-12 at even-strength (5v5), a goal-share of 42.86%, which ranks them 13th among the 16 playoff teams. They have a score-adjusted Corsi For% of 49.75, which ranks them 9th. But over the first three games of the second round, the Ducks have been the better possession team, controlling 55.7% of the shot attempts, and outscoring the Oilers 8-5. I fully appreciate the fact that the playoffs is a crap-shoot, and that anything can happen. I’d just be a little more confident if the Oiler’s goal-share and shot metrics were a little better.

The lack of calls against the Ducks has been frustrating. Anaheim finished the regular season with a penalty differential of -11, which was the 9th worst in the league. The Oilers on the other hand finished the regular season with a penalty differential of +11, which was 11th in the league. In the playoffs? The Oilers suddenly have the worst penalty differential among the 16 teams with -11. And the Ducks? They sit around the middle of the pack with a differential of 0. The league needs to be look into this, it makes no sense.

Goaltending has not been good for the Oilers against the Ducks. After finishing the first round against the Sharks with a 5v5 save percentage of 93.85%, 7th best among the 16 playoff teams, Talbot’s save percentage has dropped to 89.74%. To put things into perspective, the Flames, who were swept by the Ducks, posted a 5v5 save percentage of 90.32% in the first round against the same team. Worth noting that the Flames posted a 5v5 shooting percentage of 1.94% against the Ducks, while the Oilers currently have a reasonable 8.93% shooting percentage against the same team.

Here’s a quick breakdown of the five different line combinations the Oilers have used for at least 30 minutes at 5v5 this post-season, including their Corsi For%, Fenwick For%, Expected Goal% and actual goals for/against.

Line TOI CF% FF% xGF% GF/GA
Lucic-RNH-Eberle 85.37 57.65 58.47 55.13 1-3
Maroon-McDavid-Draisaitl 57.6 48.82 41.38 43.53 4-2
Caggiula-McDavid-Draisaitl 33.15 58.23 54.55 66.22 1-0
Caggiula-Letestu-Kassian 44.64 40.00 39.39 37.35 0-1
Pouliot-Desharnais-Slepyshev 46.43 46.51 50.00 53.82 2-0

The trio of Lucic-RNH-Eberle has played the most minutes together for the Oilers, and have Corsi For% of 57.65%, which ranks them 8th among the 45 line combinations that have played at least 30 minutes together in the post-season. Not only have the had great possession numbers, but they’re also getting a higher share of the quality chances. This is pretty impressive considering they’ve been playing tough match-ups (Thornton/Pavelski in round one, and now Getzlaf in round two). Unfortunately for them, the results haven’t come yet, as they’ve posted a shooting percentage of 2.13%. You’d think that their percentages eventually regress towards their career norms, but there really isn’t a lot of time in the playoffs for things to correct themselves. I’d keep this trio together, but would understand if the coaching staff made a tweak. One other thing worth noting is how good of a job this trio has done drawing penalties. They’re +4 together in terms of penalty differentials, which is the best among the 45 line combinations.

The Desharnais/Pouliot tandem has been playing better lately, so I would keep them together. Pouliot has also been very good on the penalty kill, so it really isn’t worth scratching him. The players I’d be worried about are Letestu and Kassian. I understand Letestu’s value on the powerplay, and would keep him in the line-up. But that line just isn’t working at 5v5, and is often allowing a lot of shots by the other team’s depth players.

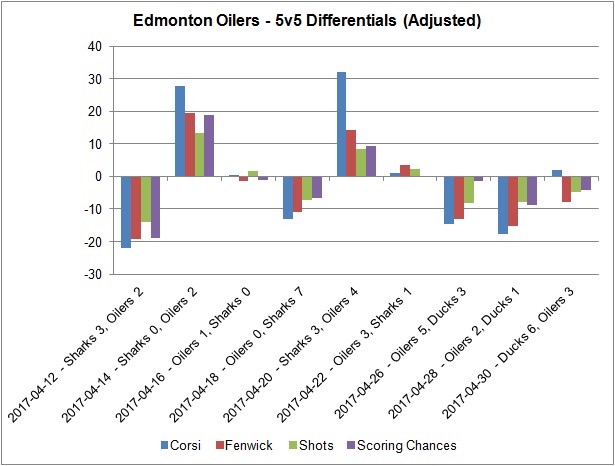
One last thing: I wanted to see how the Oilers differentials have been at 5v5 over the nine games to see if there were any patterns.

Playoff differentials - 20170501

The Oilers have yet to post good underlying numbers against the Ducks, which has me somewhat concerned. Their goaltending hasn’t been good enough in the second round, but maybe Talbot has another bounce back game on Wednesday and steals one. What also stands out in the graph above is how well the Oilers bounce back after a loss. After both losses against San Jose, the Oilers dominated play in the following game. Anaheim is a different team and might have better game plan, and health, than San Jose. But I do like the Oilers chances of putting together a better effort in game four.

Data: Natural Stat Trick, Corsica Hockey

The End Goal is the Stanley Cup + Radio spot (TSN 1260)

Just a quick follow-up to something I tweeted out after the Oilers won game two and took a 2-0 lead over the Ducks.

The Oilers are two wins away from reaching the conference finals. They finished second in their division, getting significant offence from their top line and some outstanding goaltending from Cam Talbot. The west was wide open this season, as there weren’t any offensive juggernauts like Pittsburgh or Washington, and the Oilers did a good job taking advantage. I thought their defensive game was still lacking, and relied a little too much on McDavid being on the ice, but for the most part, they didn’t ride any percentages.

It’s great to see the Oilers back in the playoffs and doing well. And I hope this post-season run  changes the expectations fans have for the team going forward.

In my mind, expectations changed once the Oilers won the draft lottery, as growth/development was no longer going to be an excuse with a talent like McDavid in the fold. And the Oilers recognized that as well hiring an experienced general manager and coach soon after.

For me, everything the Oilers do has to be geared towards winning a cup, especially with McDavid on the payroll. And a lot of my work has been based on the pursuit of become legitimate contenders and winning a championship. This has made my work pretty critical of the Oilers and management, as I’m really interested in the ways to make winning sustainable. I won’t have all of the solutions (I don’t think “hockey men” do either), but it’ll be fun discussing the Oilers now with more people demanding a championship.

Radio segment from this morning with Lowetide on TSN 1260 is at SoundCloud. Topics we covered:

  • Lack of production from Eberle
  • Potentially changing up the lines
  • Improved play of Pouliot and Desharnais
  • Defence pairings
  • Officiating and team penalty differentials

Re-cap of Game One Against the Ducks on the CBC Edmonton News (TV)

oilersducksgame1.jpg

I joined Adrienne Pan on the CBC Edmonton News to talk Oilers/Ducks. Clip is here, starts around the 18:20 mark: CBC Edmonton News (2017, April 27)

Topics we covered:

  • Contributions of Letestu, Larsson and Draisaitl in game one
  • Looked at the shots at even-strength (Data from HockeyStats.ca)
  • How McDavid and RNH handled their matchups
  • Potential changes for the Ducks and Oilers for game two

Previewing Round Two Against the Ducks on the CBC Edmonton News (TV)

20160216_OilersDucks

I joined Adrienne Pan on the CBC Edmonton News this evening to preview round two between the Oilers and Ducks. Our segment starts 12 minutes into the newscast: CBC Edmonton News (2017, April 25)

Topics we discussed:

  • What the keys were to beating the Sharks
  • How the Oilers and Ducks finished the regular season; looked at even-strength numbers (Data from Natural Stat Trick)
  • How the Oilers matched up head-to-head against the Ducks in their five games
  • The Ducks strengths and who has the edge
  • My own prediction (Oilers in 7) 😉

Comparing the Regular Season Match-ups Between the Oilers and Ducks

cut (1)

With the Oilers preparing for round two against the Anaheim Ducks, it’s worth checking out how the two teams did against each other during the regular season, and focus on what the on-ice match-ups were like.

In their five games against the Ducks, the Oilers went 3-2, outscoring them 14-12, and 9-6 at even-strength. Neither team allowed a shorthanded goal against, but the Oilers did score three powerplay goals, while the Ducks scored four with the man advantage. The Oilers had the edge in goaltending, as their team save percentage against the Ducks at even-strength was 94.4%, while the Ducks’ team save percentage was 92.9%.

Over those five games, the Oilers posted a better share of the total shot attempts with 54.2% (247-209). Heading into the playoffs, the Oilers struggled possession-wise as they had a 48.09% share of shot attempts over their final 25 games (one of the lowest in the league), while the Ducks posted a 49.85% share.

There’s going to be plenty of chatter about how each coach will deploy their personnel, so I thought it’d be interesting to break down how each of the Oilers regular centermen did against the Ducks centermen over the five regular season games. As we saw in the first round, there’s plenty of line-matching going on, not only in the past series but across the league, and it’ll likely continue against the Ducks.

Here’s how McDavid did against the three most common centers for Anaheim.

McDavid Vs TOI CF-CA CF% GF-GA
Kesler 50.01 49-37 56.98 3-1
Getzlaf 21.61 34-17 66.67 2-0
Vermette 10.45 14-6 70.00 1-0

McDavid saw a lot of Kesler in those five games, and won the share of shot attempts (56.98%). What’s worth noting is that Draisaitl was with McDavid for 36 of the 50 minutes and posted a Corsi For% of 57%. Without Draisaitl with him, McDavid still posted a strong Corsi For%, 56.1%. And when Draisaitl was away from McDavid, or didn’t have him on the ice with him, the coaches tried not to send him out against Kesler at all (less than two minutes total). And in 20 minutes against Getlzaf and 10 minutes against Vermette, McDavid was pretty dominant. It’ll be interesting to see how the Ducks try to contain him over a seven-game series.

Below is how Nugent-Hopkins did against the same trio of Ducks. His most frequent opponent was Getzlaf, who he fared well against possession-wise, but the results (i.e., goals) weren’t there.

RNH Vs TOI CF-CA CF% GF-GA
Getzlaf 37.77 31-30 50.82 0-2
Vermette 15.75 19-14 57.58 1-0
Kessler 13.53 14-10 58.33 0-0

We saw how well Nugent-Hopkins did shutting down Pavelski and Thornton on a line with Lucic and Eberle in the previous series, so his performance will be something to watch. RNH struggled over the course of the regular season, but his results improved as the playoffs approached.

Below is how Mark Letestu did over the regular season against the Ducks. His most frequent opponent was Antoine Vermette, who he’ll likely see a lot of in the upcoming series.

Letestu Vs TOI CF-CA CF% GF-GA
Vermette 12.55 12-9 57.14 1-0
Getzlaf 11.10 9-11 45.00 0-1
Kesler 4.85 4-2 66.67 0-0

Some decent results for Letestu against the Ducks over the year, which has me thinking the coaching staff will start the series keeping Draisaitl on the top line with McDavid to take on Kesler’s line, which include Silfverberg and Cogliano. Letestu should probably get more of the depth minutes than Desharnais, but I’d expect Draisaitl, or maybe even McDavid, get double-shifted to give the third line a boost. The problem for the Oilers is that Corey Perry has been moved around the roster, and has spent time alongside Vermette as well. So the Oilers really can’t take that line for granted. Letestu also struggled possession-wise against the Sharks depth players, so it’ll be imperative that the coaching staff make adjustments against a deep Ducks roster.

Data: Natural Stat Trick, Puckalytics, Hockey Reference

Full article is at The Copper & Blue.
The Secret Weapon

There are plenty of reasons why the Oilers are heading to San Jose with a 3-2 lead in the series. The goaltending has been solid for the most part. The powerplay has been looking good. And the club has received contributions from across their roster, as the defence, as well as the third and fourth lines provided offence on Thursday night.

One player that may not be getting any recognition for his contributions thus far in the post-season is 24-year old centerman Ryan Nugent-Hopkins. He recently completed his sixth NHL season, collecting 43 points in 82 games, playing predominantly in a secondary role alongside Jordan Eberle and Milan Lucic. The trio completed the regular season with a 50.5% Corsi For at even-strength and had a 50.0% goal-share, which are solid numbers considering they often played against the other team’s top lines. The coach clearly has a lot of faith in the trio as a tough-minutes option, and they have remained intact for the first five games of the playoffs.

Nugent-Hopkins in particular has stood out in this series, as his play has been reliable across all areas of the ice. He’s shown flashes of offence, creating plenty of chances for his linemates. And he’s been playing sound defensive hockey, breaking up plays and leading his team in takeaways. Nugent-Hopkins has seen plenty of Logan Couture’s line this post-season, as well as Joe Pavelski’s, and has received regular minutes against the Brent Burns/Paul Martin pairing. What’s been interesting after five games is that the team’s Corsi differential has been mostly respectable with him on the ice, but has taken a dip, especially in games three and four in San Jose, when Nugent-Hopkins is on the bench.

Game Oilers Corsi For% Oilers Corsi Diff with RNH Oilers Corsi Diff Without RNH
1 36.47 -10 -13
2 69.12 6 20
3 47.96 4 -8
4 46.25 3 -9
5 63.76 10 31

In games 2 and 5 at home when the Oilers dominated play, the team did well with and without Nugent-Hopkins. He spent over 70% of his ice time at even-strength against Pavelski in both of those games and had a Corsi differential of +6. And in those two games, Nugent-Hopkins spent over 50% of his time against Burns, the defenceman he’s seen the most of in the series, and finished with a +9 Corsi differential.

RNH - TOI - 20170421

Full article is at The Copper & Blue.

Re-capping Game Five on the CBC Edmonton News (TV)

NHL: Stanley Cup Playoffs-San Jose Sharks at Edmonton Oilers

I joined Adrienne Pan on the CBC Edmonton News to talk about game five between the Oilers and Sharks. Clip is here, starts a few minutes in: CBC Edmonton News (2017, April 21)

Topics we discussed:

  • Overtime thriller
  • What the Oilers did well against the Sharks
  • Compared the shot attempts (Data from HockeyStats.ca)
  • Emergence of Nugent-Hopkins
  • Importance of depth players
  • Martin Jones vs Cam Talbot


Reviewing the first four games

sja107-419_2017_043027_high

After the first four games, the Oilers have scored a grand total of five goals: two at even-strength, two short-handed and one on the powerplay.  San Jose is the better team right now when it comes to actual goals, thanks to their outburst in game four and the four powerplay goals.

Team Even-strength Powerplay Shorthanded
Edmonton 2 1 2
San Jose 5 5 0

I’m fairly confident that the Oilers powerplay will start to click again, considering they had great, sustainable results during the regular season, as they generated a lot of chances with the man-advantage.

The Sharks penalty kill wasn’t that great in the regular season as they allowed a lot of shots and realied heavily on their goaltending to bail them out. And the Sharks powerplay, which was one of the worst in the league in terms of goals and ranked below league-average in terms of shots, isn’t likely to ever score four again in a game.

Related: The Oilers Powerplay Could Be the Difference Against San Jose – The Copper & Blue (2017, April 11)

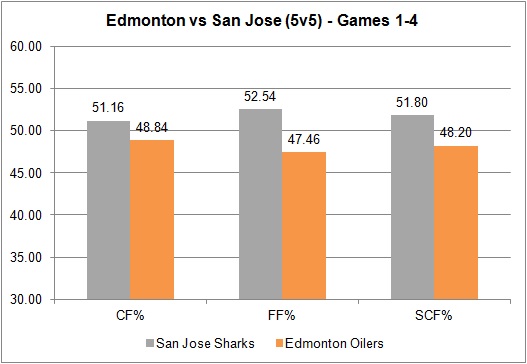
I think the issue for the Oilers is their even-strength play. Here’s how the two teams have done over the first four games.

After Game 4 - 20170420

Across all three metrics, Corsi (proxy for possession), Fenwick (proxy for shot quality) and scoring chances, the Sharks have been in control. It was only in game two that the Oilers had a share of 50% or more: CF% – 69.12, FF% – 72.09 and SCF% – 82.76. What’s interesting is that even when they dominated that game, they still could not score at even-strength, as both goals came shorthanded.

Another thing worth noting here is how poorly the Oilers have played when the score has been within one. In 135 minutes (of a total 172 5v5 minutes), CF% – 46.62%, FF% – 44.44%, SCF% – 45.38%.

What has to be emphasized are the shooting and save percentages for each team over these four games.

Team (5v5) Shooting% Save%
San Jose Sharks 5.88 97.30
Edmonton Oilers 2.70 94.12

Both the Sharks and Oilers were around league average when it came to shooting percentage in the regular season, 7.82% and 8.28% respectively. While the Sharks shooting percentage started correcting itself in game four, I think it’s safe to assume that the Oilers will eventually start converting more of their shots into goals, at least in the next two games.

As for the save percentage, we know Martin Jones is a good goalie. But I highly doubt he’ll maintain a 97% save percentage, considering he finished the regular season around the 92-93% range.

We can take the team’s struggles at 5v5 one step further and look at how the players are doing. What I’ve done below is list out the four centers, sorted by ice time, and listed their Corsi, Fenwick and Scoring Chance differentials, along with their on-ice shares.

McDavid RNH Letestu Desharnais
TOI 51.25 45.45 39.25 31.38
CF Diff 5 3 -7 -4
CF% 52.34 51.69 45.07 45.83
FF Diff -6 8 -11 -2
FF% 45.45 56.06 39.62 46.88
SCF Diff -2 3 -2 -1
SCF% 47.62 54.29 46.43 45.45

When it comes to possession, McDavid and RNH appear to be doing well, which is great news considering that they play against the other team’s top players. Letestu and Desharnais, despite playing the secondary lines, aren’t exactly getting the job done at 5v5. Letestu is a valuable piece on the powerplay, but I’d be curious to see if the Oilers move him to wing, and play Draisaitl more often at center. Desharnais on the other hand could easily be replaced by Lander or even Hendricks, who can both play on the penalty kill (unlike DD). I mention the penalty kill because RNH is seeing a ton of minutes shorthanded, which disrupts his 5v5 line that’s been very reliable over the past four games.

When it comes to shot quality (again, I’m using Fenwick as my proxy), it appears that every center except for RNH is doing poorly. McDavid with a -6 differential is very surprising considering his talent level, but it might have to do with San Jose sending out Vlasic and Braun out against him on a regular basis. With game five at home, it’ll be important for McLellan to get McDavid out there as much as possible and away from the pairings that have been causing him issues.

Looking at the Oilers defence, it appears that the usual suspects are on the ice for a higher rate of shot attempts and scoring chances against. The Sekera-Russell pairing, which played similar competition as the Klefbom-Larsson pairing, continues to struggle suppressing shots.

Player TOI CA/60 FA/60 SCA/60
Larsson 66.02 57.26 39.99 20.90
Klefbom 60.07 51.94 33.96 17.98
Russell 57.83 69.51 45.65 24.90
Nurse 54.97 57.85 42.57 22.92
Sekera 54.87 67.80 45.93 27.34
Benning 39.10 46.04 36.83 21.48

The fact that the Oilers are posting lower than 50% shares of shot attempts and scoring chances should be a concern for the club. A lot of the issues they’re currently having (poor outputs from depth centers, higher than normal shots against when certain defencemen are out) were identified in the regular season, but weren’t addressed by management. Now that they’re in the playoffs, they’ll have to hope McDavid and the top line can break out, and the team shooting percentage regresses towards their season long average. I know I’d have a lot more confidence if their shot-shares were better.

Data: Natural Stat Trick