Bringing Back Horcoff

horcoffHear me out.

For the first time in a long time, the Oilers are poised to start a season with four legitimate centermen. Ryan Nugent-Hopkins and Anton Lander made some very nice progress last season, while Boyd Gordon, who is in his last season of his three-year contract, played consistently in both ends of the ice. Connor McDavid will be in the starting line-up in October and at this point I’ll assume he’ll be at center.

We’ll also have Leon Draisaitl (truly) competing for a roster spot in training camp. I hope he flourishes and makes a huge push, but I would not be disappointed if Leon spends a season in the AHL to refine his game. Keep in mind, the AHL’s California teams will play less games next season and focus more on player development. Young prospects like Leon will get more ice time and more opportunities to play different situations.

As of today, the 2015-2016 forwards roster looks something like this:

LW C RW
Pouliot RNH Eberle
Hall McDavid Yakupov
Pakarinen Lander Purcell
Hendricks Gordon Klinkhammer

Not bad, right? And you can easily shift guys around and even entertain the idea of having Draisaitl somewhere on the wing.

My concern here is that the Oilers would be absolutely hooped if one of the centermen got hurt. The other issue is that Lander might regress or Gordon might start slowing down due to the workload. Plus, it might be best that McDavid ease his way in to the NHL by playing wing with an experienced centerman. Draisaitl could possibly be that replacement player, but it would make no sense to stunt his development because the Oilers weren’t deep enough at center.

What I propose is that the Oilers acquire an experienced centerman who could play wing, but shift to center as needed. Someone who could slide into that third line left-wing spot and play some special teams as needed. And with a young core, it’ll be imperative that the club bring in a proven leader to provide guidance.

The Candidate

Shawn Horcoff will be an unrestricted free agent on July 1, just completing his six year, $33 million contract that he signed with the Oilers in 2008. He’s 36 years old now, having played 946 NHL games and scoring 496 points. There is no question that his career will be coming to a close soon, but it’s his performance last season that has me thinking he could be a productive player for the Oilers next season.

Below is a summary of his play at even-strength over the past five seasons (Source: War on Ice).

Season Team Gm G P A TOI/Gm P60 CF% ZSO%
2010/11 EDM 47 4 14 10 13.83 1.29 48.42 50.73
2011/12 EDM 81 7 16 9 13.37 0.89 47.08 42.99
2012/13 EDM 31 4 8 4 11.3 1.37 42.38 40.57
2013/14 DAL 77 1 13 12 10.16 1.00 48.65 52.38
2014/15 DAL 76 6 22 16 10.06 1.73 52.68 50.99

Horcoff notched 29 points last season, with 22 of those points coming at even-strength. His offensive zone starts were down slightly from the previous year, but he managed to perform better in terms of productivity and possession. He played limited minutes in Dallas, and produced at a third-line level.

What should be noted is that Horcoff played a lot on the wing, as the Stars had Seguin, Spezza, Eakin and Fiddler as pivots. Horcoff still took a lot of faceoffs, but he was 6th on the team in faceoff attempts (Source: NHL.com).

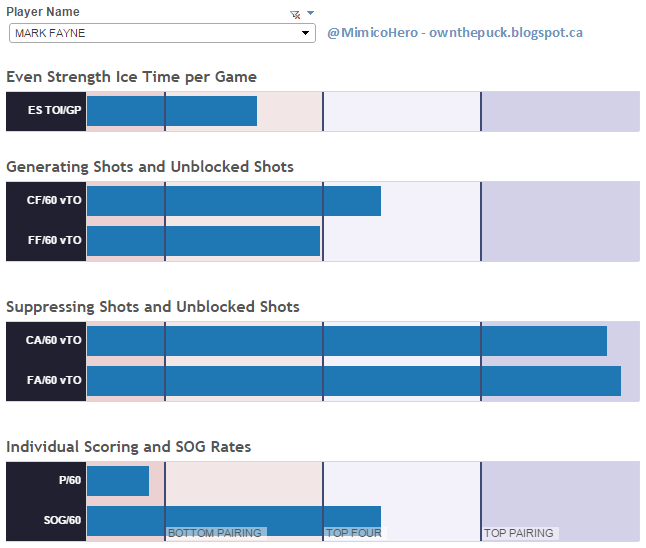
Horcoff’s two most common linemates last season were Vernon Fiddler and Colton Sceviour (Source: Hockey Analysis). Here’s a quick summary of how they fared together and apart.

Corsi % (Even strength)
Linemate With Horcoff Without Horcoff
C. Sceviour 55.0 52.7
V. Fiddler 53.1 48.5

Horcoff away from these two had a decent Corsi. What’s interesting is how both his linemates posted slightly better Corsi’s when Horcoff was with them. Horcoff might be getting older, but he’s not at the point where he drags down teammates. It should be noted that Horcoff had reasonable zone starts and typically went against the other club’s bottom six forwards.

Dallas Stars 201415

The key thing to consider is that Horcoff filled the kind of role the Oilers really need this year: an experienced forward, who can produce on the third line, not be a drag on his linemates and make a seamless transition to center when needed. He did a little bit of everything, serving as a mentor to the younger players in Dallas.

And if you want some “toughness” and “grit” and whatever on the third line, he’s your guy:

I can’t imagine a lot of teams lining up to sign him due to his age, so the acquisition cost should be low. The other issue of course is whether Horcoff would want to sign in Edmonton, likely preferring to join a cup contender. My guess is that because of McDavid and the reputable management team in place now, Edmonton would be a prime destination for many, including Horcoff.

And if Horcoff doesn’t fit what the Oilers want, here’s hoping they strongly consider adding an experienced center through trade or free agency. It’s absolutely critical.

Comparing the Oilers by Position to the Rest of the League

rsz_game43rnh3Andrew Berkshire recently put together a nice piece comparing the point production of the Montreal Canadaiens to the rest of the league by position. He does a nice providing realistic expectation of players and setting benchmarks for different positions. I thought it’d be interesting to see how the 2014-2015 Oilers measure up with the rest of the NHL.

Below is a summary table of the point ranges by line and position. What Andrew did was find the range of points based on the top 30 players at the position. Second line range was based on players ranked 31st-60th at that position, and the third line range was based on the 61st-90th ranked players. Please note, I prefer evaluating players based on even-strength play, so I focused on those numbers.

Point Range (Even-strength)
Line Left Wing Center Right WIng
1 33-59 39-60 29-55
2 22-32 31-39 19-29
3 11-20 24-30 11-19

So how did the Oilers rank in 2014-2015?  Below are the points for each player, by position, at even-strength. I’ve also included the players’ points/60 and the average time on ice per game to provide some context (Source: War on Ice).

Centers (Even-Strength)
Name Gm P P60 TOI/Gm
Ryan Nugent-Hopkins 76 37 1.92 15.25
Derek Roy 46 16 1.50 13.92
Anton Lander 38 11 1.46 11.87
Boyd Gordon 68 10 0.86 10.23
Mark Arcobello 36 8 1.04 12.85
Leon Draisaitl 37 7 1.03 11.01
Left Wings (Even-Strength)
Name Gm P P60 TOI/Gm
Taylor Hall 53 26 1.86 15.83
Benoit Pouliot 58 24 1.98 12.55
David Perron 38 15 1.75 13.53
Matt Hendricks 71 10 0.79 10.75
Luke Gazdic 40 3 0.61 7.43
Rob Klinkhammer 40 3 0.40 11.14
Jesse Joensuu 20 2 0.63 9.57
Right Wings (Even-Strength)
Name Gm P P60 TOI/Gm
Jordan Eberle 81 41 1.98 15.30
Nail Yakupov 81 21 1.20 12.99
Teddy Purcell 82 20 1.11 13.23
Matt Fraser 36 7 1.10 10.65
Steven Pinizzotto 18 3 1.31 7.62
Andrew Miller 9 3 1.44 13.88
Tyler Pitlick 17 2 0.59 12.05
Iiro Pakarinen 17 1 0.36

9.75

Here’s where the Oilers fit compared to the ranges from Andrew’s piece.

Point Range (Even-strength)
Oilers 2014-2015
Line LW C RW
1 Eberle
2 Hall
Pouliot
RNH Yakupov
Purcell
3 Perron

Couple thoughts:

  • RNH made significant strides this past season and is well on his way to becoming a star. His point totals just missed the cut-off to be a first line center, but there should be no issues for him going forward.
  • Hall had an off-year, but you can be sure he’ll be back to elite status next season.
  • Eberle is the only player who falls into the first line category based on even-strength points. He’s not the most productive player, as in he gets a lot of minutes. But he’s become a very consistent player for the club.
  • My guess is if Lander had a full season, he’d make a push to fall under the third-line center category. It is good to know what the realistic expectations should be of him.
  • Since the guy played all the tough minutes last season, Gordon doesn’t have to show up in these tables. The guy is awesome.
  • Man, I cannot believe we’ll have McDavid, RNH and Draisaitl as our centermen in the near future. Good Lord.

Leaving the University of Alberta Alumni Council

Source: UAlberta.ca

Source: UAlberta.ca

It’s been a fantastic experience with the Alumni Council. Got to meet a lot of people and worked on some great projects over the two years.

In my first year, I was the faculty representative for Extension. In my second year, I was part of the executive team and appointed to the Senate. Got to learn about many different facets of the U of A community and the impact this campus has on the community.

If you’ve ever considered re-connecting with the U of A, I highly recommend getting involved with the Alumni Association. It’s a well run group that has many projects and initiatives underway. I can’t say enough about the volunteers and the supporting staff. The Council has grown over the past year, with a lot of new members coming in. Look forward to seeing what they do they can accomplish in the coming year.

There are also many, many ways to volunteer on campus. There’s a lot of programs and services across campus that are worth checking out and connecting with. Two groups that are doing outstanding work are University Wellness Services and the Office of Sustainability. Highly recommend learning more about what they do.

I’ve categorized all my posts pertaining to the Alumni Council here. Feel free to contact me if you have any questions about it.

Quality Starts Percentage

neuvirth

Adjusted Save Percentage, developed and published by War on Ice, is a very well thought out stat, and I’ve relied on it heavily the past few weeks looking at goalies. Darcy put together a fantastic post recently that looked into the history of the available goalies and found some interesting stuff. Highly recommend checking out his assessment.

I decided to use Darcy’s list of goalies and focus on their percentage of Quality Starts over the past five years. I’ve also included the number of games started in parentheses. Please note, QS% relies on traditional save percentage data (not adjusted) and factors in all situations (even-strength, powerplay, penalty kill).

From Hockey Abstract:

In order to record a Quality Start, the starting goalie must stop at least a league average number of shots (typically 91.3% prior to 2009-10, and 91.7% since), or play at least as well as a replacement-level goalie (88.5%) while allowing two goals or fewer.

The average QS% is 0.530, with anything lower than 0.500 being pretty bad. Having a QS% above 0.600 is very good (Source: Hockey Reference). More on Quality Starts can be found on Habs Eyes on the Prize.

Unrestricted Free Agents
Player Age 2010/11 2011/12 2012/13 2013/14 2014/15
Antti Niemi 31 0.617 (60) 0.529 (68) 0.674 (43) 0.469 (64) 0.542 (59)
Devan Dubnyk 28 0.545 (33) 0.548 (42) 0.541 (37) 0.355 (31) 0.685 (54)
Jhonas Enroth 26 0.538 (13) 0.682 (22) 0.778 (9) 0.538 (26) 0.429 (42)
Karri Ramo 28 0.514 (37) 0.452 (31)
Michal Neuvirth 26 0.477 (44) 0.500 (30) 0.583 (12) 0.692 (13) 0.531 (32)
  • Antti Niemi is a good to average goalie, but he’s too old at this point to invest in. He’ll get paid this summer, but I don’t expect him to get better with age..it just does not  happen.
  • Look at that: Dubnyk was right around the average QS% until that horrendous 2013/14 season. Glad to see he has bounced back.
  • Jhonas Enroth has done well historically, but his value may have taken a hit this past season. This guy has to be a legit target for a number of teams.
  • Ah, and there’s our good friend Michal Neuvirth. He’s only 26 and has put up some nice numbers over the past three years but hasn’t started a lot.
Goalies Under Contract Who Could Be Acquired
Player Age 2010/11 2011/12 2012/13 2013/14 2014/15
Antti Raanta 25 0.545 (22) 0.667 (12)
Ben Scrivens 28 0.455 (11) 0.588 (17) 0.629 (35) 0.373 (51)
Brian Elliott 29 0.333 (51) 0.778 (36) 0.600 (20) 0.600 (25) 0.600 (45)
Cam Talbot 27 0.842 (19) 0.500 (34)
Corey Crawford 30 0.618 (55) 0.491 (55) 0.679 (28) 0.554 (56) 0.696 (56)
Craig Anderson 33 0.592 (49) 0.567 (60) 0.708 (24) 0.500 (52) 0.571 (35)
Jimmy Howard 30 0.476 (63) 0.614 (57) 0.619 (42) 0.500 (50) 0.531 (49)
Jonas Hiller 32 0.565 (46) 0.542 (72) 0.56 (25) 0.540 (50) 0.512 (43)
Jonathan Bernier 26 0.636 (22) 0.462 (13) 0.667 (12) 0.612 (49) 0.481 (54)
Jonathan Quick 29 0.617 (60) 0.632 (68) 0.556 (36) 0.531 (49) 0.58 (69)
Kari Lehtonen 31 0.559 (68) 0.610 (59) 0.600 (35) 0.563 (64) 0.462 (65)
Martin Jones 25 0.722 (18) 0.455 (11)
Robin Lehner 23 0.200 (5) 0.800 (5) 0.833 (12) 0.633 (30) 0.458 (24)
  • I included Ben Scrivens since he’s penciled in, at this point, to be the backup next season.
  • Guys like Annti Raanta and Martin Jones have talent, but just haven’t had enough experience, in my opinion, to make a reasonable bet on.
  • Brian Elliot has been pretty steady when it comes to QS%, but his adjusted save percentages have been all over the map historically.
  • Crawford, Howard, Lehtonen and Anderson are getting up there in age, but they’ve been playing well recently. Their current clubs are going to have to make changes because of the cap, making for an interesting off-season.
  • Jonathan Bernier is another interesting goalie. He’s put up decent numbers and is only 26. He’d be at the top of my wish list.
  • Robin Lehner is another good, young prospect, but I’d be concerned about his health as he’s recovering from a significant concussion. At this point, the Oilers need a legit starter or someone that has enough experience to push for a starting position. Worth noting that he along with Devan Dubnyk and Eddie Lack were impacted by the rule changes around stick length in 2013.

Between what I’ve read and what Darcy has put together, I really don’t know what to think anymore. I’d stick with Scrivens as the backup as I think he can bounce back, similar to other goalies in the past. The starting position has to go to someone that’s in their prime (26-30) and has at least 300 games of NHL experience. I don’t like the idea of over spending on goaltending, so Niemi, to me, is out of the question. If a trade can’t be made to acquire someone like Corey Crawford or Jonathan Bernier, the Oilers may have to push hard for Devan Dubnyk or sign Michal Neuvirth or Enroth to value contracts. Lots of options, so here’s hoping Chiarelli takes a “measured approach”.

Goalies and Voodoo Magic

Jan 29, 2014; Edmonton, Alberta, CAN; Edmonton Oilers goalie Ben Scrivens (30) stops a shot during the third period against the San Jose Sharks at Rexall Place. The Oilers won 3-0. Mandatory Credit: Candice Ward-USA TODAY Sports ORG XMIT: USATSI-138256 ORIG FILE ID:  20140129_lbm_wb4_281.JPG

Without a doubt, one of the weakest links of the Oilers in 2014/2015 was the goaltending. Both Scrivens and Fasth failed to lock down the starter position, finishing the season with adjusted save percentages in the bottom five (goalies who played 20 games or more).

One thing we know about goalies is that a  lot of voodoo is involved. One season, a goalie can be terrible and the next, he’s winning games in the playoffs. One could argue that even assessing goalies involves a lot of guess work and truthiness, as a lot of factors come into play. Which team is the goalie on, how does the team do possession wise, does the team have a strong defensive core, and so forth.

I really want to believe that Scrivens can bounce back. After a good college and minor league career, he had shown well in his NHL career. Unfortunately, things went sideways this past season, but I don’t think we can write him off just yet.

To make a case, I first looked at how he measures up against the average adjusted save percentage (at even-strength) among goalies who played 20 or more games. And secondly, I looked for other goalies who may have had a rough season (or two) and bounced back.

Performance

Let’s start off with Ben Scrivens’ history.

Season Team Gm Age GP W L T/O QS% AdSv%
2011/12 TOR 12 25 12 4 5 2 0.455 91.66
2012/13 TOR 20 26 20 7 9 0 0.588 92.33
2013/14 EDM/L.A 39 27 40 16 16 4 0.629 93.43
2014/15 EDM 57 28 57 15 26 11 0.373 90.88

This past season stands out as his worst in terms of adjusted save percentage (at even-strength) and the number of games he gave his team a chance to win (QS%). His adjusted save percentage, which factors in the quality of shot (low, medium, high danger), as well as his save percentage of high danger shots at even strength, was well below average.

Line-BenScrivens

Last season, and the year prior, he was alright when it came to adjusted save percentage at even strength…right around the average. His save percentage when it came to high danger shots at even-strength were slightly above average two seasons ago, and not too far off the average last season. I should also note that his save percentage when it came to high danger shots was at 82.96 when Eakins was head coach in 2014/2015, and 79.82 when Nelson was head coach. Scrivens’ adjusted save percentage did not change after goaltender coach Freddie Chabot was fired, but his high-danger save percentage went from 83.84 under Chabot to 79.92 under Schwartz (Source: War on Ice). Maybe it was the team tactics under one coach or the fact that Petry was dealt at the deadline, I’m not sure. But those are all factors at play here.

Comparables

In a previous post, I used the percentage of quality starts to find other goalies who had terrible seasons, similar to Scrivens. Goalies that also had QS% below 0.400 since 2007 include well-established netminders like Brian Elliott, Mike Smith, Devan Dubnyk and Semyon Varlamov (Source: Hockey Abstract). I decided to graph each goalies adjusted save percentage compared to the average as well as their high-danger save percentage along with the average. Again, this is for even strength situations and includes netminders who played 20 or more games in a season.

Line-BrianElliott

Line-MikeSmith

Line-DevanDubnyk

Line-Varlamov

Couple notes:

  • I think it goes without saying that goalies can be hard to predict. But when goalies have a bad season, they typically bounce back the following year.
  • Man, Elliott and Smith are all over the map.
  • Our boy Devan Dubnyk was trending well before he had that bad season in 2013/2014. So happy to see him bounce back and get recognized for his accomplishments.

Thoughts

Ben Scrivens has a lot of work to do this summer if he wants to get back to an acceptable performance level. He’s in the last year of a two-year contract and will likely be in the AHL next season if he has another sub-par season. There are only so many roster sports for netminders.

The good news is other goaltenders have had seasons with a QS% below 0.400 but have managed to bounce back and maintain employment at the NHL level. These goalies have also seen their adjusted save percentages take a hit throughout their careers, but have still managed to remain as starters in the NHL. At the end of the day, it’ll be up to Scrivens to put this past season behind him, make the right adjustments in the off-season and put together a solid campaign as an Edmonton Oiler. The club would be wise to assign him the backup role, but I really think he could push for that starter position in 2015/2016.

Goalies with Potential

Source: Edmonton Oilers

Source: Edmonton Oilers

I’m of the mindset that having a young goalie with starter potential would be a smart move by the Oilers. Initially, I thought a goalie like Cam Talbot or Martin Jones, who are currently serving as backups, would be smart acquisitions, similar to how the Leafs acquired Jonathan Bernier in June of 2013 for a second round pick. If a goalie has been successful at the AHL level and has shown well in a limited role at the NHL level, that to me is good enough to warrant at least an assessment.

Alex Thomas, who does excellent work at the Oilers Rig, recently put a case together for acquiring Cam Talbot from the Rangers. The 27 year old played well while Lundqvist recovered from an injury. But his stats and style of play, to me, aren’t anything outstanding. In fact, his numbers at the NHL level and other leagues are somewhat similar to that of current Oilers netminder Ben Scrivens.

Here’s their NHL seasons to date. (Source: Hockey Reference)

Cam Talbot
SEASON TEAM LEAGUE GP W L OT  PCT SO
2013-14 NY Rangers NHL 21 12 6 1 0.941 3
2014-15 NY Rangers NHL 36 21 9 4 0.926 5
Ben Scrivens
SEASON TEAM LEAGUE GP W L OT PCT SO
2011-12 Toronto NHL 12 4 5 2 0.903 0
2012-13 Toronto NHL 20 7 9 0 0.915 2
2013-14 Total LA/Edm NHL 40 16 16 4 0.922 4
2014-15 Edmonton NHL 57 15 26 11 0.890 1

Here’s a summary of each netminders overall stats by league:

Cam Talbot
LEAGUE GP W L OT MIN. PCT SO
NHL 57 33 15 5 3306 0.931 8
AHL 116 54 52 5 6611 0.914 8
ECHL 2 1 0 1 122 0.921 0
CHA 70 15 44 3861 0.909 2
Ben Scrivens
LEAGUE GP W L OT MIN. PCT SO
NHL
129
42
56
17
7135
0.905
7
AHL 94 49 34 7 5547 0.923 8
ECHL 13 10 3 0 779 0.938 0
ECAC 117 65 37 6708 19

Both goalies have come through the college ranks and have performed well at the AHL level. There’s no denying that they both have potential to be decent at the NHL level. The issue for Oilers fans is that Scrivens faltered badly last year in his first real attempt to be a starter, while Talbot appears to be ready for his first shot.

In my opinion, if you want a “goalie with potential” for next season, stick with Ben Scrivens. Two reasons:

One, Scrivens won’t cost you anything. He”ll make a very reasonable $2.3 million next year becoming a free agent in July of 2016 (Source: NHL Numbers). Talbot, on the other hand, will likely cost the Oilers either a draft pick or a young prospect in return. Goalies are not worth first round picks. And goalies are not worth high end prospects like Nail Yakupov. Nothing of that calibre should be in play. Goalies should never command that kind of return as there are a limited number of goalie jobs and more than enough professional goalies available. If the price for Talbot is high, the Oilers could always consider trading for similar “starter potential” goalies like Martin Jones, Antti Raanta or Andrei Vasilevskiy. But it’d be much wiser to spend existing assets on positions that are harder to fill such as defence.

Secondly, I’m fairly confident that Scrivens will bounce back from his horrific 2014/2015 season. Good to average goalies like Scrivens are susceptible to bad seasons, and typically get back to their standard level of performance soon after. We know Scrivens can play at the AHL level and he has done well in the three seasons prior at the NHL level.

One stat that’s worth paying attention to is the percentage of quality starts. Here’s a summary of the metric from from Habs Eyes on the Prize:

A Quality Start (QS) is a goaltending statistic that is awarded to a goaltender who gave his team a reasonable chance to win a game. This is quantified by the goaltender’s save percentage within an individual game itself and comparing it to the league standards for an average SV%, and the established ‘replacement level’ SV% if the goalie faces a low amount of shots faced in a given game (usually less than 20). If a goalie outperforms the league average save percentage, he is awarded a quality start. Additionally, a goalie is awarded a quality start if he allows 2 goals or less while keeping his save percentage above the expected performance of a replacement level goaltender.

Scrivens finished with a QS% of 0.396 this past season, which was second last among goalies who played a minimum of 20 games. In last place: Victor Fasth at 0.375. The league average for goalies is around 0.530. Worth noting that Scrivens has had a respectable QS% in the past. (Souce: Hockey Abstract).

Ben Scrivens
Season Team GS SV% QS%
2011-12 Toronto 11 0.9063 0.455
2012-13 Toronto 17 0.9116 0.588
2013-14 LA/Edmonton 35 0.9262 0.657
2014-15 Edmonton 53 0.8879 0.396

The good news is that other good goalies have had horrific seasons similar to Scrivens’ 2014/2015 campaign. Of those that finished with a QS% below 0.400 since 2007, the vast majority have bounced back and managed to have decent careers. A few of the notables.

Brian Elliott
Season Team GS SV% QS%
2007-08 Ottawa 1 0.9655 1.000
2008-09 Ottawa 30 0.9024 0.500
2009-10 Ottawa 48 0.9100 0.563
2010-11 Ottawa/Colorado 51 0.8940 0.333
2011-12 St. Louis 36 0.9401 0.778
2012-13 St. Louis 20 0.9034 0.600
2013-14 St. Louis 25 0.9237 0.640
2014-15 St. Louis 45 0.9170 0.578
Cam Ward
Season Team GS SV% QS%
2007-08 Carolina 67 0.9042 0.567
2008-09 Carolina 68 0.9158 0.618
2009-10 Carolina 45 0.9162 0.556
2010-11 Carolina 73 0.9223 0.589
2011-12 Carolina 68 0.9151 0.559
2012-13 Carolina 16 0.9075 0.438
2013-14 Carolina 28 0.9004 0.393
2014-15 Carolina 50 0.9085 0.560
Devan Dubnyk
Season Team GS SV% QS%
2009-10 Edmonton 16 0.8870 0.313
2010-11 Edmonton 33 0.9155 0.545
2011-12 Edmonton 42 0.9172 0.548
2012-13 Edmonton 37 0.9199 0.541
2013-14 Edmonton/Nashville 31 0.8895 0.355
2014-15 Arizona/Minnesota 55 0.9300 0.673
James Reimer
Season Team GS SV% QS%
2010-11 Toronto 35 0.9202 0.571
2011-12 Toronto 34 0.9004 0.353
2012-13 Toronto 31 0.9235 0.516
2013-14 Toronto 32 0.9108 0.469
2014-15 Toronto 27 0.9056 0.444
Mike Smith
Season Team GS SV% QS%
2007-08 Tampa Bay 32 0.9040 0.469
2008-09 Tampa Bay 40 0.9151 0.625
2009-10 Tampa Bay 36 0.9035 0.389
2010-11 Tampa Bay 20 0.9021 0.500
2011-12 Arizona 66 0.9294 0.636
2012-13 Arizona 34 0.9104 0.441
2013-14 Arizona 61 0.9152 0.574
2014-15 Arizona 61 0.9044 0.475
Semyon Varlamov
Season Team GS SV% QS%
2008-09 Washington 5 0.9216 0.800
2009-10 Washington 23 0.9068 0.478
2010-11 Washington 25 0.9239 0.720
2011-12 Colorado 52 0.9125 0.577
2012-13 Colorado 33 0.9027 0.333
2013-14 Colorado 60 0.9284 0.733
2014-15 Colorado 57 0.9213 0.579

Obviously, each goalie had their own unique situation, and there are always 1,001 factors that impact goalie performance. But the general trend is that goalies who have a poor QS% one year, tend to bounce back soon after. Scrivens has his work cut out for him this summer if he wants to improve. But in my mind, the Oilers should retain him as their “goalie-with-potential” paired with an established netminder this coming season, and avoid sending away assets for guys like Cam Talbot.

Goaltending for the 2015-2016 Season

ranford-maskIssue: The Edmonton Oilers must solidify their goaltending for the upcoming 2015-2016 NHL season.

Background

The Oilers finished 28th this past season. allowing the most goals at even-strength, while finishing 26th in goals-for. Their Corsi-for (at even strength, score adjusted) was 47.3%, 24th in the league, while their percentage of scoring chances was 45.6%, ranking them 26th in the league.

Goaltending was a key contributor to the Oiler’s issues this past season. The tandem of Ben Scrivens (28 years old) and Victor Fasth (32) finished last in adjusted save percentage at even strength. Of the 48 goalies who played a minimum of 1,000 minutes in 2014/2015, Scrivens and Fasth finished 46th and 48th, respectively (Source: War on Ice). Below is a summary of their performance.

Age Games Save % (Adj) QS%
B. Scrivens 28 57 90.88 0.373
V. Fasth 32 26 90.36 0.417

Please note, adjusted save percentage takes into account the location of the shots faced by the goalie. Quality starts calculates what percentage of games the netminder gave his team a  chance to win (Source: Hockey Abstract). The league average is roughly 0.530.

Current Status

  • Scrivens has one year remaining on his contract with the Oilers, who will pay him $2.3 million in 2015/2016. Fasth will be an unrestricted free agent as of July 1, 2015, coming off a contract that paid him $3.4 million in his final season (Source: NHL Numbers).
  • The Oilers have the following goaltenders in their system:

Key Considerations

  • The salary cap will be increasing from $69 million to $71.5 million starting next season. Teams like Chicago, Boston, New York and St. Louis, who have players with sizable contracts, as well as prospects needing new contracts, may struggle with cap issues.
  • Goaltending does not have to be a large financial commitment to ensure success. Anaheim, Washington, Detroit and Tampa Bay were in the bottom five in terms of spending on goalies, and managed to make the playoffs this past season (Source: NHL Numbers)
  • Goaltending performance tends to decline with age (Source: Globe and Mail). According to one review, “goaltending development tends to peak around 23 and maintains in top form until 26” (Source Pension Plan Puppets).
  • The acquisition and eventual signing of Scrivens was based on his potential, as he had performed relatively well in LA and Toronto. There is a chance that Scrivens can bounce back next season and challenge for the starting position.
  • The Oilers have not established an NHL-calibre defence core for the 2015-2016 season yet. At the end of last season, Justin Schultz (23 years old) and Oscar Klefbom (20) were handling top pairing minutes, with the former struggling to produce despite the favorable deployment.

Option 1: Acquire an experienced goalie through free agency.
Risk: Low        Cost: Medium/High

To assess the options, I searched for the free agent goalies who played more than roughly 1,000 minutes and had respectable save percentages and/or quality starts. The cost of free agency is typically high due to the volatility of the market.

A. Niemi
Season Team Age Games TOI Save %
(Adj)
Save %
(High and Medium
Danger Shots)
QS%
2010/2011 S.J 27 60 2,813.8 93.45 88.84 0.617
2011/2012 S.J 28 68 3,166.2 93.25 88.62 0.529
2012/2013 S.J 29 43 2,034.5 93.08 88.14 0.674
2013/2014 S.J 30 64 2,949.1 92.37 86.78 0.469
2014/2015 S.J 31 61 2,899.2 92.83 87.17 0.542
M. Neuvirth
Season Team Age Games TOI Save %
(Adj)
Save %
(High and Medium
Danger Shots)
QS%
2010/2011 WSH 22 46 2,069.1 92.57 87.86 0.477
2011/2012 WSH 23 38 1,593.2 92.02 86.92 0.500
2012/2013 WSH 24 13 576.3 91.46 84.80 0.583
2013/2014 BUF/WSH 25 15 650.5 92.69 89.18 0.692
2014/2015 NYI/BUF 26 32 1,477.0 93.13 87.66 0.531
J. Enroth
Season Team Age Games TOI Save %
(Adj)
Save %
(High and Medium
Danger Shots)
QS%
2010/2011 BUF 22 14 619.3 92.94 86.25 0.538
2011/2012 BUF 23 26 1,098.0 93.13 89.46 0.682
2012/2013 BUF 24 12 490.5 93.7 89.93 0.778
2013/2014 BUF 25 28 1,241.1 93.45 89.78 0.538
2014/2015 DAL/BUF 26 50 2,302.4 92.34 87.33 0.429

Option 2: Acquire an experienced goalie through trade.

Risk: Medium        Cost: Medium/High

Because teams are either up against the cap or have an excess of capable goalies, established netminders may be available this summer, so it would be worth assessing the potential trade options. This option would require dealing existing assets, either players or draft picks, and may leave a gap in other areas of the roster.

C. Anderson
Season Team Age Games TOI Save %
(Adj)
Save %
(High and Medium
Danger Shots)
QS%
2010/2011 OTT/COL 29 51 2226.8 92.45 87.56 0.592
2011/2012 OTT 30 63 2724.6 93.02 87.64 0.567
2012/2013 OTT 31 24 1086.2 94.59 89.33 0.708
2013/2014 OTT 32 53 2321.2 92.85 88.06 0.500
2014/2015 OTT 33 35 1597.1 93.63 89.81 0.571
B. Elliott
Season Team Age Games TOI Save %
(Adj)
Save %
(High and Medium
Danger Shots)
QS%
2010/2011 COL/OTT 25 55 2362 90.96 83.33 0.333
2011/2012 STL 26 38 1737.8 94.73 91.29 0.778
2012/2013 STL 27 24 1029.8 92.68 87.79 0.600
2013/2014 STL 28 31 1293.8 92.29 87.92 0.600
2014/2015 STL 29 46 2021.7 92.83 88.84 0.600
C. Crawford
Season Team Age Games TOI Save %
(Adj)
Save %
(High and Medium
Danger Shots)
QS%
2010/2011 CHI 25 57 2686.5 93.46 89.09 0.618
2011/2012 CHI 26 57 2538.8 92.41 87.06 0.491
2012/2013 CHI 27 30 1372.1 93.98 89.39 0.679
2013/2014 CHI 28 59 2738.6 92.98 89.12 0.554
2014/2015 CHI 29 57 2676.9 93.83 88.73 0.696

Option 3: Acquire a goalie that has limited experience but has potential upside.
Risk: High       Cost: Low

This option would involve the most risk, and would involve extensive collaboration with the scouting department and possibly further data analysis. A number of unproven goalies have excelled in the right situation such as Ben Bishop (TB), Devan Dubnyk (MIN) and Jonathan Bernier (TOR). The key will be to keep the cost low and refrain from dealing high-end prospects or future first round picks.

C. Talbot
Season Team Age Games TOI Save %
(Adj)
Save %
(High and Medium
Danger Shots)
QS%
2013/2014 NYR 26 21 961 94.24 90.32 0.842
2014/2015 NYR 27 36 1689.5 93.51 89.65 0.500
M. Jones
Season Team Age Games TOI Save %
(Adj)
Save %
(High and Medium
Danger Shots)
QS%
2013/2014 L.A 23 19 862.3 95 93.2 0.722
2014/2015 L.A 24 15 626.5 92.31 87.84 0.455
A. Raanta
Season Team Age Games TOI Save %
(Adj)
Save %
(High and Medium
Danger Shots)
QS%
2013/2014 CHI 24 25 1115.1 90.59 84.35 0.545
2014/2015 CHI 25 14 659.5 94.54 90.8 0.667

Recommendations

The Oilers must solidify their goaltending in order to compete for the playoffs next season. This will be costly as the team lacks organizational depth, and has failed in developing a netminder on their own. The team must explore all options, including free agency and trade.

Having reviewed the options and the players available, it would be best if the Oilers moved forward with one established goalie, supported by a netminder that has the potential to be a starter. The team will have to keep the cost of goaltending low as the team must acquire defencemen this summer, likely through free agency.

Ben Scrivens is a good-to-average goalie with numbers to indicate that he has the potential to bounce back and possibly push for the starting position. It would not make sense, at this point, to acquire another goalie like Talbot or Martin, who are in a similar situation as Scrivens.

B. Scrivens
Season Team Age Games TOI Save %
(Adj)
Save %
(High and Medium
Danger Shots)
QS%
2011/2012 TOR 25 12 545.2 91.66 87.80 0.455
2012/2013 TOR 26 20 808.5 92.33 86.34 0.588
2013/2014 EDM/L.A 27 39 1728.3 93.43 89.59 0.629
2014/2015 EDM 28 57 2650.4 90.88 86.20 0.373

The Oilers must acquire a proven netminder such as Neuvirth through free agency, or Elliott through trade. Both Niemi and Crawford would be expensive acquisitions, with the former likely commanding a term that takes him to retirement. It may be beneficial for the Oilers to acquire a player that has familiarity with the western conference, and can handle a higher proportion of high-quality shots and scoring-chances against.

Whichever goalie the Oilers acquire must be placed in a position to succeed. The team must improve the defense by acquiring at least two established defencemen this summer and find an experienced coach that can maximize this teams potential. Moving forward the team has to establish a long term plan and developmental strategy for prospects to ensure that the club is not in this situation again.

The McDavid Effect

BklbK7ICQAEfipd

Source: TSN.ca

When Bill Daly turned the golden card, I honestly didn’t even hear the words (might have zoned out). I just saw the card and laughed maniacally for a good 15 minutes, frightening my kids in the process. I was happy to hear McDavid would be coming to Edmonton. But I was laughing at what the fallout would be for the roster, for the fans and for the city. And especially what the perception and outrage would be outside of Edmonton.

The negativity towards the team by outsiders is warranted. This team has been pitiful for almost a decade, so the thought of McDavid heading to a poorly managed organization will fire up a lot of people. And the negativity will grow similar to how the Penguins get taunted because they have Crosby and Malkin. The hate towards Edmonton is real folks, and it’s gonna get worse once McDavid in the lineup.

Getting a talented player like McDavid is going to put pressure on management to get their act together. Get a goaltender. Get a couple defencemen. And get a coach. Surround this “generational talent” with the right players, because the entry-level years are going to fly by. And like Darcy mentioned in the Lowdown with Lowetide roundtable, McDavid will be commanding good money once the three years are done, and it’ll be around the time that Hall and Eberle are finishing up their mega-contracts. The pressure will be from fans and from the entire league to ensure this player does well, so the Oilers have moved towards adding experience to the front office.

What the addition of McDavid also does is improve the Oilers chances of signing some free-agents who may not have considered Edmonton a possible destination. And the Oilers increased their chances even more by bringing in Chiarelli, who can leverage his network to connect with players, or even rival GMs if he chooses to go the trade route.

The roster will have to be revamped as soon as possible, pushing those that were MacTavish’s acquisitions (i.e., Schultz, Nikitin) towards the exit. I’m hoping that Chiarelli moves forward building off the success of the existing minor league program, and refrain from bringing in say, his Boston/Providence connections. Lateral moves, something that happened when Eakins was coach, really aren’t necessary.

Chiarelli as GM gives me a lot more confidence in Oilers management. He’s the first GM hired by the Oilers who has past experience as GM. Plus he has a familiarity, and a relationship, with managers across the league, something MacTavish was still in the process of building towards. I didn’t mind the hiring of MacTavish as I thought he’d be able to bring some new ideas and apply something from his graduate school experience. But really, he should’ve been placed in an assistant GM role first before making the jump. Similar to what Steve Yzerman did with Detroit before moving on to Tampa Bay.

A lot of changes have been made because of McDavid and the kid has yet to play a game. We’re already feeling the impact as fans, and I think there’ll be even more to come especially with player personnel  this summer. And if the off season changes are this big, imagine what impact McDavid will have on his teammates and the overall success of the on-ice product when the season starts.

This should be fun.

Recommended Links

Old Boys Club Pronounced Dead – Copper and Blue

Beautiful Sunday – Lowetide

Bottoms Up: The Kool-Aid Kid – Oil Acumen

Is…Is This Happiness? – Black Dog Hates Skunks

Edmonton Oilers Shouldn’t Expect Connor McDavid to Match Sidney Crosby’s Rookie Scoring – Cult of Hockey

Mieux Respirer – Lowetide

Saving Justin Schultz

Source: Edmonton Oilers

Source: Edmonton Oilers

One of the most glaring weaknesses on the Oilers this past season, and the year prior, has been the blueline. Both seasons under MacTavish have started and ended without a complete, competitive, NHL caliber defense core.

One member of the Oilers defence who has taken a lot of flak, for good reason, has been young Justin Schultz.

As you recall, Schultz leveraged an existing clause in his contract with Anaheim to leave the Ducks, who had drafted him 42nd overall in the 2009 draft, to become an unrestricted free agent, coming straight out of college. A number of teams expressed interest, with the Oilers being his chosen destination.

If you were his agent, you saw the obvious need on defence in Edmonton, and recognized the ample opportunity available for Schultz in terms of ice time and linemates up front. In his three seasons with the Oilers, he has been given an absurd amount of ice time for a prospect, spending the vast majority of time with the high end talent up front. He’s been labelled as an offensive-defenceman since college, so the Oilers have tried their best to put him in a position to succeed.

Unfortunately, things just haven’t gone well for Schultz. Despite the ice time, over the years and the offensive zone starts, especially this year, Schultz has struggled to produce both in terms of points and possession (Source: War on Ice).

20122013 20132014 20142015
Games 48 74 81
Goals 4 9 6
Assists 7 10 13
Points 11 19 19
Points per 60 0.82 0.89 0.77
% of Offensive Zone Starts 47.95% 45.17% 62.85%
Corsi For % 42.99% 41.69% 49.24%
Corsi For per 60 47.11 45.33 54.01
Corsi Against per 60 62.47 63.42 55.69
Shots For % 42.05% 42.17% 50.01%

It’s clear that the Oilers rushed Schultz into the NHL, giving him top minutes in his first three seasons but with little support around him, unlike other comparable college players. He’s an excellent skater and can move the puck well, especially in the offensive zone. But his defensive lapses and poor passing out of his own zone are a sign of inexperience and undeveloped skill. Ideally, he should be in the minors working out these things, but instead he’s being paid, and paid quite well, to learn the position at the NHL level.

Having said that, we have to consider that this defencemen is only 24. We know it takes longer to learn this position, with most hitting their primes much later than say a winger or a centerman.

So what I did was take a look at the top 10 defencemen by zone starts (minimum 250 mins played) just to see if there are comparables to Schultz. The idea being that maybe there were others that had similar numbers as Schultz despite the high percentage of offensive zone starts. And maybe they improved later on or teams found a way to get more out of the player. Note: Corsi is based on Score adjusted formula.

2014/2015 (Defencemen, 5v5)
Name Age Team ZSO% Gm TOI P60 CF% C+/- SF%
Jamie.McBain 26 L.A 69.40 26 288.38 1.25 53.82 37.07 55.40
David.Rundblad 23 CHI 68.66 49 582.18 1.24 56.04 127.40 52.72
Jakub.Kindl 27 DET 67.79 35 460.07 0.78 58.45 133.44 56.49
Justin.Schultz 24 EDM 62.85 81 1483.86 0.77 49.24 -41.43 50.01
Dan.Boyle 38 NYR 61.54 65 1040.77 0.69 53.96 149.55 53.88
Xavier.Ouellet 21 DET 61.41 21 312.95 0.58 58.59 88.29 55.32
Brian.Campbell 35 FLA 61.01 82 1444.07 0.54 54.08 204.08 55.02
Victor.Hedman 23 T.B 60.88 59 971.88 1.36 54.68 159.00 54.94
Aaron.Ekblad 18 FLA 60.70 81 1385.90 0.95 53.49 168.91 55.05
Brayden.McNabb 23 L.A 60.32 71 996.67 1.14 57.74 259.39 57.34
2013/2014 (Defencemen, 5v5)
Name Age Team ZSO% Gm TOI P60 CF% C+/- SF%
Torey.Krug 22 BOS 65.87 79 1114.61 1.02 56.55 274.34 55.88
Michal.Rozsival 35 CHI 65.04 42 624.79 0.77 59.66 201.64 59.74
John.Moore 22 NYR 63.42 74 1005.41 0.60 51.42 51.85 52.89
Eric.Gelinas 22 N.J 62.99 60 828.93 0.80 52.65 68.32 49.58
Nick.Leddy 22 CHI 62.95 82 1132.65 1.01 57.82 309.39 57.23
Kevan.Miller 25 BOS 62.08 47 710.35 0.42 52.60 61.99 51.88
Ryan.Murphy 20 CAR 61.69 48 713.42 0.67 47.43 -69.48 45.32
Dennis.Wideman 30 CGY 61.60 46 794.11 1.06 44.86 -152.64 48.55
Sheldon.Brookbank 32 CHI 61.31 48 584.19 0.72 52.01 41.82 51.57
Carlo.Colaiacovo 30 STL 60.80 25 329.73 0.55 53.08 34.84 53.09
2012/2013 (Defencemen, 5v5)
Name Age Team ZSO% Gm TOI P60 CF% C+/- SF%
Marc-Andre.Bergeron 31 CAR/T.B 74.16 25 266.18 0.68 54.35 42.32 54.10
Alec.Martinez 25 L.A 64.29 27 360.77 0.50 59.55 112.56 59.64
Peter.Harrold 29 N.J 63.75 23 336.75 0.18 60.67 102.58 56.47
Michal.Rozsival 34 CHI 63.07 27 419.07 1.43 61.89 165.05 62.58
Bobby.Sanguinetti 24 CAR 62.06 37 468.82 0.51 56.12 109.72 54.92
Patrick.Wiercioch 22 OTT 61.90 42 525.44 0.91 58.04 160.11 55.73
Brian.Campbell 33 FLA 60.91 48 923.54 0.45 49.65 -11.39 48.90
Paul.Postma 23 WPG 60.71 34 429.88 0.70 52.32 35.50 49.62
T.J..Brennan 23 FLA/BUF 60.71 29 419.41 0.86 47.71 -34.63 47.47
Derek.Morris 34 PHX 60.00 39 654.12 0.64 52.54 62.27 51.33

Oof.

Well, what we see here is that if you’re starting that much in the offensive zone, you SHOULD have a respectable Corsi For % and a decent shot share. And if you don’t…well, that’s a bad sign. Schultz stands out, along with players like Dennis Wideman, as the few that got poor results despite the favorable minutes. Note: I did go back to 2006 and got similar findings.

The Oilers management group appears to be enamored with young Schultz, handing him a $3.75M contract last summer, while pushing an established defencemen like Jeff Petry out of the organization. If this management group, including the new members on board, feel that Schultz is part of the plan’s moving forward, they’ll have to do a few things.

  1. Manage the expectations of the player by choosing actions and words carefully. Avoid Norris trophy references and label Schultz for what he is: a prospect with second pairing capabilities and a good powerplay option. Reduce his minutes and deploy more experienced players in the offensive zone. Which leads to point 2…
  2. Get legit, NHL defencemen to take on the top minutes. These players have to be in their late 20’s with at least 300 NHL games played. Offensive zone starts are hard to come by, so when you’re there, have your best available option out there. At the top of my list would be Andrej Sekera. And the more I read about him, I’m learning more about his old defensive partner in Carolina, Justin Faulk (we got McDavid, so hey, why not try to land both of them?). An experienced defenceman could also partner with Schultz, and stabilize the play when Schultz is joining the rush.
  3. Improve the goaltending and reduce the amount of time the team is trailing. In a situation where a team is pressing for a goal, players like Schultz are relied on heavily. Hopefully Scrivens can bounce back from a pitiful season, but I’d bring in a Cam Talbot type to stabilize the netminding.

Schultz has a lot of work to do this summer in terms of his defensive work, especially in his own zone. There were a few too many times he looked lost, often chasing forwards from the front of the net to the corner, leaving a passing lane wide open. Offensively, he created chances, but he was often caught up ice, allowing a 2-on-1 going the other way.

It’s unfortunate that Schultz has transitioned from being a prospect to being more of a project for the Oilers. The good news is, teams can have an offensive defenceman on their roster, even with defensive flaws. They just have to make sure the rest of the defensive roster is well built with a legitimate number one pairing. The Oilers have an opportunity to resurrect a young player’s career, but only if they can make the right moves this summer.

Oilers Defence in HERO Charts

Oilers_superheroBelow are the HERO (Horizontal Evaluative Rankings Optic) charts for the Oilers defencemen. These charts have been created and maintained by Domenic Galamini and serve as a fantastic visualization tool. He’s clearly put some thought into what metrics are used and how the data is laid out for forwards and defencemen.

As with any analytics, these charts do not serve as an end-point for discussion and really should be used as a starting point for further analysis. Please note, the charts include the past three seasons (2012/13, 2013/14, 2014/15).

I found that the charts were pretty accurate in labeling the Oilers defencemen as first, second or third pairing. Obviously there’s other factors to consider, but I think the metrics give some good insight into the players.

One note from the Own the Puck:

What does vTO mean? It stands for “versus Teammates and Opposition”. For example, GF60 vTO is calculated as follows… ( GF60 – Teammate GF60 ) + ( League Avg GF60 – Opposition GA60 ). All stats used in the calculation of vTO metrics are adjusted for zone starts by nixing play that occurs within 10 seconds of off and def zone faceoffs.

Andrew Ference

FerenceHERO

Nikita Nikitin

NikitinHERO

Justin Schultz

SchultzHERO

Oscar Klefbom

KlefbomHERO

Mark Fayne

FayneHERO

Martin Marincin

MarincinHERO