With the first round of the playoffs set to begin, I wanted to get a sense of how both teams finished the season, what their key drivers were and how individual players performed.
The Oilers we know have been outstanding since the coaching change, going 19-4-2 in their final twenty-five games, a points percentage of 0.800 – second best in the league only behind Minnesota who went 19-3-3 in their last twenty five games. The Oilers had the highest all-situations goal-share in the league, posting a +35 goal differential due in large part to their outstanding play at even-strength, solid goaltending and excellent results on the penalty kill.
The Kings had solid results as well over their final twenty-five games, going 13-8-4, which translates into a 0.600 points percentage. And while they did a solid job out-shooting opponents at even-strength and generating an average rate of shots on the powerplay and preventing shots on the penalty kill, they only posted a -6 all-situation goal-differential – a 47.89% goal-share that ranked 18th in the league.
Even-strength (5v5)
Here’s how the two teams performed at even-strength (5v5) over their final twenty-five games.
| Last 25 games, 5v5 | Oilers | Kings |
|---|---|---|
| Points% | 0.800 | 0.600 |
| Corsi For% | 53.38 | 53.08 |
| Fenwick For% | 53.25 | 54.13 |
| xGoals For% | 52.74 | 52.92 |
| Goals For% | 55.46 | 45.45 |
| Shooting% | 9.01 | 6.99 |
| Save% | 91.59 | 90.44 |
The two clubs are fairly evenly matched when it comes to shot-share metrics, with both teams posting a Corsi For% and Fenwick For% above 53% – right around what top teams typically post. The Kings have been doing it a lot longer this season, as we know the Oiler’s process metrics, especially their share of quality scoring chances, only improved after the coaching change. Regardless, what’s apparent is the big difference in scoring talent, as the Oilers finished with the 11th best team shooting percentage in the league at even-strength while the Kings were dead last. Full details on how the Oilers and Kings rank within the western conference can be found here. A summary table can also be found in the Appendix at the end of the article..

Goaltending (5v5)
The Oilers also got great goaltending at the end of the season, with Mike Smith posting some of his best numbers in his career and posting a save percentage above 94%. Below are the Oilers and Kings goalies from the last twenty-five games, with their rankings among the 61 goaltenders who played at least 250 minutes.
| Goalie (5v5) | GP | TOI | Save% | High-danger Save% | GSAA |
|---|---|---|---|---|---|
| Mike Smith | 13 | 619 | 0.941 (4th) | 0.857 (11th) | +7.46 (5th) |
| Jonathan Quick | 14 | 636 | 0.923 (16th) | 0.849 (17th) | +5.48 (19th) |
| Mikko Koskinen | 13 | 604 | 0.894 (54th) | 0.761 (58th) | -7.46 (56th) |
| Cal Petersen | 12 | 591 | 0.884 (58th) | 0.807 (41st) | -5.48 (59th) |
Worth noting that while he wasn’t playing at the level of Smith, Jonathan Quick was still above league average levels in the last stretch of the season posting a goals-saved above average (GSAA) of +5.48 (19th among 61 goalies) and a high-danger save percentage of 0.849 (17th). Both Koskinen and Pedersen ranked fairly poorly, which will make it an interesting series if one of the starting goalies struggle.
Special teams
The Edmonton Oilers powerplay had a strong finish to the season, generating the highest rate of shots per hour (70.38) in the league over the final twenty-five games, and scoring over 10 goals per hour – ranking 6th best overall. These numbers were consistent with their full-season results on the powerplay, largely driven by their top end players and their overall tactics.
And while the Kings generated the fourth highest rate of shots on the powerplay in their final twenty-five games, they were again let down by their shooting talent, as they could only muster 5.34 goals per hour – ranking 25th in the league. These results were also consistent with their full-season results.
| Powerplay (Last 25 games) | Oilers | Kings |
|---|---|---|
| Shots for/60 | 70.38 (1st) | 64.56 (4th) |
| Goals for/60 | 10.37 (6th) | 5.34 (25th) |
| Team shooting% | 14.73% (11th) | 8.27% (28th) |
The Kings did pretty well on the penalty kill, allowing 7.82 goals against per hour (16th in the league) due in large part to their play in front of their goalies. They allowed the 10th lowest rate of shots against in the league, and got league average goaltending.
The Oilers penalty kill on the other hand relied completely on their goaltending, as they allowed the fourth highest rate of shots against in the league, but got the best team save percentage (93.53%). I’m a little skeptical that the Oilers goaltenders will be able to maintain this level considering their full-season save percentage was 87.53% – which ranked 10th in the league. The Kings could find an edge here considering they have consistently generated chances on the powerplay, something the Oilers need to be mindful of.
| Penalty Kill (Last 25 games) | Oilers | Kings |
|---|---|---|
| Shots against/60 | 62.21 (29th) | 52.15 (10th) |
| Goals against/60 | 4.03 (2nd) | 7.82 (16th) |
| Team save% | 93.56% (1st) | 85.00% (20th) |
Skaters (5v5)
Another thing I wanted to see ahead of the series was how the players on each team did in terms of on-ice shot and goal differentials at even-strength (5v5) over the final twenty-five games. Just to get a sense of which players are playing well, but might not be getting the results.
Below are all of the Oilers skaters, sorted by their on-ice goal differential (Goals +/-), with the Oilers top line players leading the way.
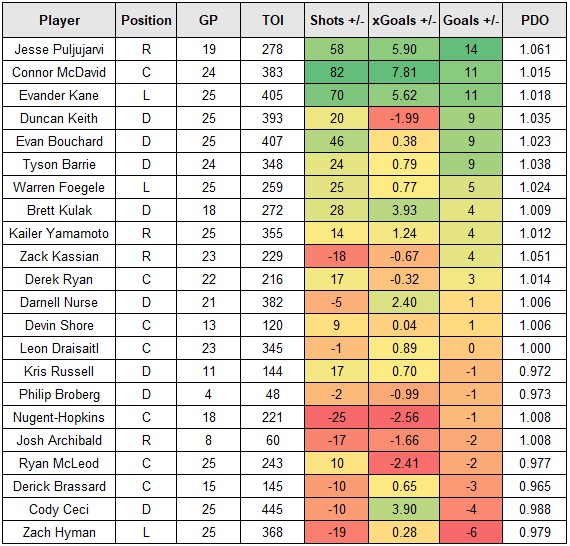
Puljujärvi, McDavid and Kane had excellent results at 5v5 to finish the season, with all three posting solid shot differentials. McDavid is a major driver for results, but it’s worth noting that even when away from McDavid, Puljujärvi is posting strong numbers. Over this final stretch of games, Puljujärvi has played 111 minutes away from McDavid (about 40% of his total ice time), and posted an on-ice expected goal-share of 64%, and an on-ice goal-share of 70% (7 GF, 3 GA). For comparison, Kane has played 63 minutes away from McDavid (about 15% of his total ice time), and posted an on-ice expected goal-share of 41% and on-ice goal-share of 60% (3 GF, 2 GA). It’s clear Kane needs McDavid to thrive, while Puljujärvi seems to post solid numbers offensively and defensively, wherever he is in the line-up. That’s an important player to have come playoff time when line matching and finding any sort of edge becomes critical.
One player that will need to improve for the playoffs is Nugent-Hopkins, who posted poor shot-differentials over the last twenty-five games. He’s not getting the tough match-ups, so I’m suspecting either there’s an injury issue he’s dealing with or he’s struggling with not having consistent linemates. Regardless, he and others including Hyman and Draisaitl will have increased roles in the playoffs so hopefully whatever ails them can be fixed by the coaching staff.
Looking at the Kings skaters, only Athanasiou was riding percentages to close the year. The key player to watch is Arthur Kaliyev who posted excellent on-ice shot and expected goal differentials, but couldn’t convert those into actual goals. Both Kopitar and Danault are worth watching closely, as they’ll likely see a lot of the top lines. Plus they can hold their own and challenge for offence as well. The Kings do have some good supporting talent including Kempe who scored 35 goals this season and Arvidsson who has a history of scoring – so we’ll see if they can turn things around in the playoffs. And while they’ve been without Doughty who helps more offensively, the Kings have been fine over the last twenty-five games allowing the fifth lowest rate of shots against at even-strength in the league and the 10th lowest rate of expected goals against. The Oilers were closer to league average defensively. For a deeper dive into the Kings line combinations, check out Sid’s work here.

Thoughts
The Oilers have the edge when it comes to talent up front, and their goaltending was much better at the end of the season. But the Kings have been pretty solid as well posting similar shot-share numbers as the Oilers, and playing very well defensively both at even-strenth and the penalty kill. And while their goaltending hasn’t been great, Quick has been performed slightly above average over the Kings last twenty-five games. So it shouldn’t surprise anyone if he steals a game or two. If the Kings can pressure the Oilers defence, which could still potentially be exploited, and capitalize on their chances, this might be a longer series than some might anticipate.
Should be a great first round!
Data: Natural Stat Trick, Puck IQ
Appendix A: Summary of the western conference (Source)

Glossary:
- Points-percentage (Point%) – The total points accumulated divided by the points that were available, including extra time.
- Corsi For percentage (CF%) – The proportion of all the shot attempts the team generated and allowed that the team generated (i.e., Corsi For/(Corsi For + Corsi Against). This is used as a proxy for possession and is the best at predicting a team’s future share of goals (GF%). (Source: Hockey Great Tapes – Draglikepull)
- Fenwick For percentage (FF%) – The proportion of all the unblocked shot attempts the team generated and allowed that the team generated (i.e., Fenwick For/(Fenwick For + Fenwick Against). This is used as a proxy for shot quality and considers shot blocking a repeatable skill.
- Expected Goals For percentage (xGF%) – This is a weighting placed on every unblocked shot based on the probability of the shot becoming a goal. This depends on the type of shot, location and uses historical shot and goals data to come up with the probability for each unblocked shot.
- Goals For percentage (GF%) – The proportion of all the goals that the team scored and allowed that the team generated (i.e., Goals For/(Goals For + Goals Against).
- Shooting percentage (SH%) – The percentage of the team’s shots on goal that became goals (i.e., total goals divided by the total shots on goal).
- Save percentage (SV%) – The percentage of the team’s shots on goal against that were saved (i.e., 1-(totals goals allowed divided by the total shots on goal against)

Pingback: Pulse check | The SuperFan
Pingback: Reviewing the Oilers vs Kings | The SuperFan
Pingback: Previewing the Oilers vs Flames | The SuperFan