At the half-way point of their regular season, the Edmonton Oilers are tied with Anaheim for foruth place in the Pacific dvision with a 0.573 points percentage.
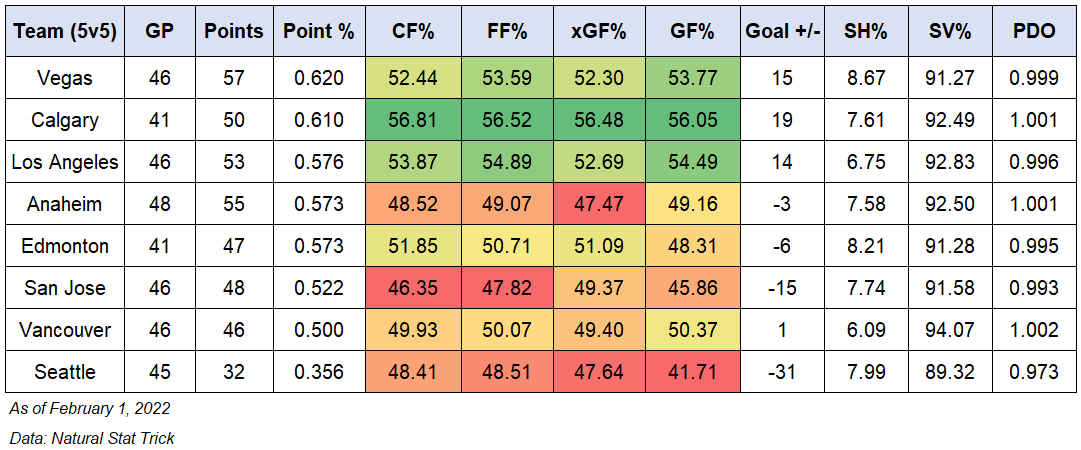
The table above contains the even-strength (5v5) numbers for each team in the Pacific division (sorted by points percentage) including goal-share results as well as the shot-share metrics that gives us a sense of which teams have the right processes in place and if the results are sustainable or not. I’ve also applied a basic heat-map to show which teams are doing well or struggling relative to their division foes. You can find a description of each metric at the end of this article. Also note that the shot-share metrics are score and venue adjusted based on Natural Stat Trick’s methodology.
Since my last check-in in late December 2021, Vegas and Calgary have switched spots in the Pacific while Los Angeles has jumped over Anaheim and Edmonton. Not too susprised about that considering the Kings have been playing well at even-strength, controlling the flow of play, and consistently getting better goal-share results than Edmonton and Anaheim.
The battle for third, fourth and fifth in the Pacific is really going to come down to each club’s special team units. Edmonton’s powerplay continues to be one of the best in the league, while their penalty kill is struggling. Anaheim is doing well in both areas. And the Kings aren’t good at either.
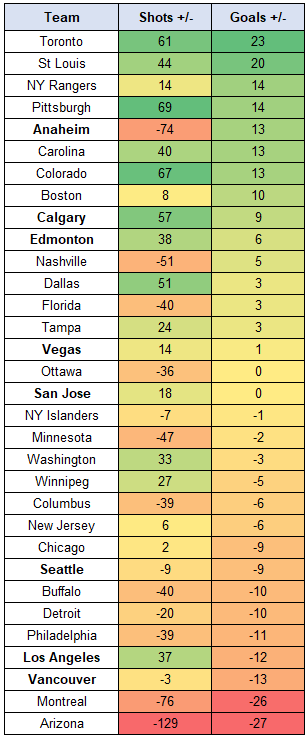
The table to the right is sorted by every team’s special-teams goal differential – basically adding up all of the goals scored and allowed on the powerplay and penalty kill. I’ve also included each team’s shot differential, and applied a basic heat map. The Pacific division teams are in bold.
Edmonton currently ranks 10th in the league thanks in large part to their powerplay, and it’s safe to assume they’ll be in this range considering they do a good job of generating shots and scoring chances. Anaheim stands out for a couple reasons. They’re obviously getting excellent results, posting a combined special-teams goal differential of +13 – fifth best in the league. But they don’t do a good job generating shots on the powerplay or preventing shots on the penalty kill – ranking 30th in the league.So it’ll be interesting to see if they can sustain their positive goal-differential results.
Los Angeles stands out here as well. Their results have been poor, ranking 29th in the league here. But they do a decent job generating shots on the powerplay and preventing shots on the penalty kill. Again, something to watch for over the last half of the season if they can get some saves on the penalty kill.
Data: Natural Stat Trick
Glossary:
- Points-percentage (Point%) – The total points accumulated divided by the points that were available, including extra time.
- Corsi For percentage (CF%) – The proportion of all the shot attempts the team generated and allowed that the team generated (i.e., Corsi For/(Corsi For + Corsi Against). This is used as a proxy for possession and is the best at predicting a team’s future share of goals (GF%). (Source: Hockey Great Tapes – Draglikepull)
- Fenwick For percentage (FF%) – The proportion of all the unblocked shot attempts the team generated and allowed that the team generated (i.e., Fenwick For/(Fenwick For + Fenwick Against). This is used as a proxy for shot quality and considers shot blocking a repeatable skill.
- Expected Goals For percentage (xGF%) – This is a weighting placed on every unblocked shot based on the probability of the shot becoming a goal. This depends on the type of shot, location and uses historical shot and goals data to come up with the probability for each unblocked shot.
- Goals For percentage (GF%) – The proportion of all the goals that the team scored and allowed that the team generated (i.e., Goals For/(Goals For + Goals Against).
- Shooting percentage (SH%) – The percentage of the team’s shots on goal that became goals (i.e., total goals divided by the total shots on goal).
- Save percentage (SV%) – The percentage of the team’s shots on goal against that were saved (i.e., 1-(totals goals allowed divided by the total shots on goal against).
