It’s amazing how the Oilers penalty kill is likely going to be what sinks their 2017/18 season. While the club’s goal-share is a hair below 50% at even-strength, it’s the rate of goals allowed when shorthanded that has driven down their overall goal-share to 46%, 23rd in the league.
Another way to look at it is in terms of goal-differential. What I’ve down below is graph out the cumulative goal-differential over the course of the season, separating out even-strength (5v5) and penalty kill (4v5), and including a line for all game states.

Here we see that while the team gradually improved their even-strength scoring in November and December, it didn’t do much to help their overall goal-differential largely because of their weak penalty kill. Up until this point, the Oilers have allowed a league worst 39 goals when shorthanded; last season they allowed 43 over 82 games.
Whatever happens from now until the end of the season, there’s going to be plenty of questions around the penalty kill for both management and the coaching staff to answer. Did the team have the right player personnel? Did the coaches have the right tactics in place? Were the right players deployed? There’s going to be a full review of the penalty kill with management likely taking significant action this coming off-season to rectify the issue.
But before doing all of that the Oilers really should be asking themselves why they didn’t see this coming. The fact is, their current problems on the penalty kill existed last season, but management did very little to address these issues.
In 2016/17, the Edmonton Oilers finished 17th in penalty kill efficiency with 80.7%, and 14th overall when it came to goals against per hour with 6.73. The Oilers struggled to limit the rate of shot attempts against finishing the season 24th overall with 107.76 per hour, and at some points were the worst in the league. For the penalty kill to remain competitive, they relied heavily on the play of Cam Talbot, who over the course of the season often ranked in the top 10 among goaltenders shorthanded.
The Oilers were also terrible at limiting the rate of high-danger shot attempts against, finishing third worst in the league with 25.65 per hour. A sizable proportion (23.8%) of the total shot attempts against were from the high danger area, also third worst in the league.
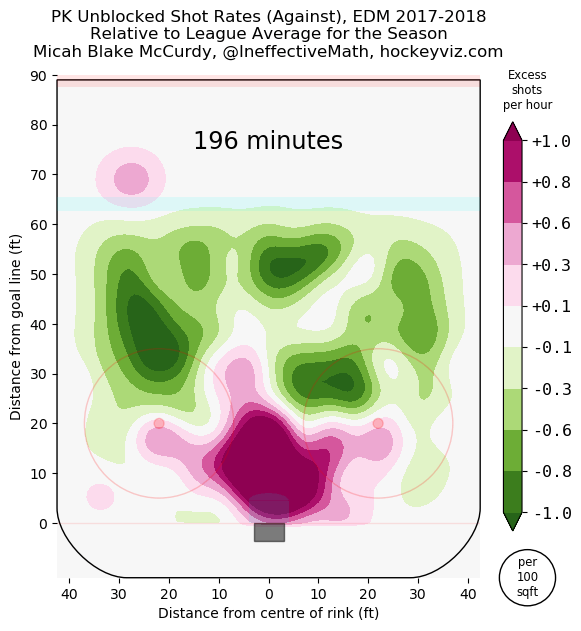
This season, that trend has continued. While the Oilers have done a better job of limiting the overall shot attempts against, a very high proportion of these shot attempts have been from high-danger areas. We’ve seen this regularly – the Oilers penalty kill often giving up two-on-ones, missing assignments allowing for easy tap-in’s and failing to keep shots to the outside. 29.7% of the shot attempts allowed this year are from the high-danger area, the highest proportion in the league and significantly worse than last season.
We can also compare the shots against from last season to this season using the heat maps available on HockeyViz. Here’s how things have been for the Oilers this season., relative to the league average. Note the density of purple around the Oilers goal, indicating how much worse they are compared to the rest of the league.
And here’s how things were last season for the Oilers shorthanded. Over 382 minutes, the Oilers were allowing a much higher rate of shots against from in close compared to the league average, and struggled elsewhere as well. Things were not good for the Oilers when shorthanded last season, and they somehow managed to get worse.

Just for comparison, here’s how the Bruins shot map looks this season.

The Bruins currently rank third overall in goals against per hour, and are top 10 in the league in terms of limiting shot attempts and high danger shot attempts. Not nearly as high of a density of shots against around the net, and well below the league average.
Another thing worth pointing out are the individual players who did well in terms of their on-ice rates of high danger chances against when shorthanded. Below are all of the Oilers skaters from last season who played at least 40 minutes at 4v5 and what percentage of the shot attempts against were from the high-danger area when they were on the ice. The table is ranked from best to worst.
| Player | GP | TOI | % of Shot Attempts that were High-danger |
| Drake Caggiula | 60 | 41.0 | 18.2% |
| Benoit Pouliot | 67 | 90.8 | 19.1% |
| Connor McDavid | 82 | 66.9 | 19.6% |
| Matt Hendricks | 42 | 63.5 | 21.6% |
| Kris Russell | 68 | 158.5 | 22.5% |
| Andrej Sekera | 80 | 163.1 | 22.6% |
| Anton Lander | 22 | 41.9 | 22.7% |
| Matthew Benning | 62 | 43.6 | 22.9% |
| Adam Larsson | 79 | 127.3 | 23.1% |
| Ryan Nugent-Hopkins | 82 | 143.3 | 24.4% |
| Mark Letestu | 78 | 166.6 | 24.7% |
| Oscar Klefbom | 82 | 137.7 | 25.0% |
| Darnell Nurse | 44 | 52.3 | 25.5% |
| Eric Gryba | 40 | 52.4 | 26.7% |
| Zack Kassian | 79 | 87.2 | 28.3% |
Couple interesting things, especially at the top of the list. What we see here is that when Pouliot was on the ice, the Oilers did well in limiting the rate of high danger chances. The actual shot rates against were pretty good as well, but it still didn’t stop the team from buying his contract out. Andrej Sekera was another player that did well when looking at these numbers, making it rather unfortunate that he started the season hurt.
So while we know things are bad today for the Oilers and they’re allowing a lot of goals, the underlying numbers are pretty close to what they were last season. Because of the overall success they had in 2016/17, it appears that the penalty kill issues were largely ignored. Management likely assumed that Talbot would continue to excel and didn’t consider that their goaltender’s performance could regress the way it has. Considering how much of a workload they’ve assigned to their starting netminder, this was a really poor bet on management’s part and it’s coming back to haunt them.
Thoughts
The failures of the penalty kill should raise a number of questions for the team and force both the management and the coaching staff to dissect their problems as much as possible. There’s plenty of issues in regards to roster construction, tactics and deployment, and the team has the resources to find a reasonable solution.
But more importantly, the Edmonton Oilers need to review and alter their approach to performance assessment, and start to examine things much more critically to have success. With the in-house expertise they have and the data and information available, the Oilers have everything they need to make more sound and reasonable decisions. Even when the team is doing well in an area of the game, the Oilers need to question things, determine if their success is sustainable or not and continuously find ways to improve. If they continue doing what they’re doing and ignore the underlying data and analysis, it’s going to put their championship aspirations at risk.
Data: Natural Stat Trick, Corsica Hockey, Hockey Viz
Related articles:
Checking in on the Oilers Penalty Kill – The Copper & Blue (2016, November 10)
Improving the Oilers Penalty Kill – The Copper & Blue (2017, January 29)
The Oilers Penalty Kill is Killing Penalties Again – The Copper & Blue (2017, March 31)

Pingback: The Oilers’ penalty kill was finally addressed | The SuperFan