It hasn’t been a great start to the season for Oscar Klefbom.
The 24-year old defencemen has been on the ice for a lot of goals against, being caught out of position and making poor reads that have led to scoring chances. While Klefbom’s on-ice shot shares have been fine for someone who regularly plays against the best competition, the Oilers actual results with him on the ice have been terrible. Klefbom currently has a 36% on-ice goal-share at even-strength (5v5), with the Oilers being outscored 16-9 with him on the ice.
| GP | CF% | FF% | GF% | On-Ice SH% | On-Ice SV% | PDO |
| 17 | 52.31 | 52.60 | 36.00 | 5.43 | 89.89 | 0.953 |
Because of his poor goal-share (and possibly some other coaching tactics), Klefbom has been split up from Adam Larsson, a partnership that was originally penciled in as the top pairing with Andrej Sekera out indefinitely. Klefbom is now skating with Matt Benning and is less frequently getting the top pairing minutes he received on a much more regular-basis while paired with Larsson.
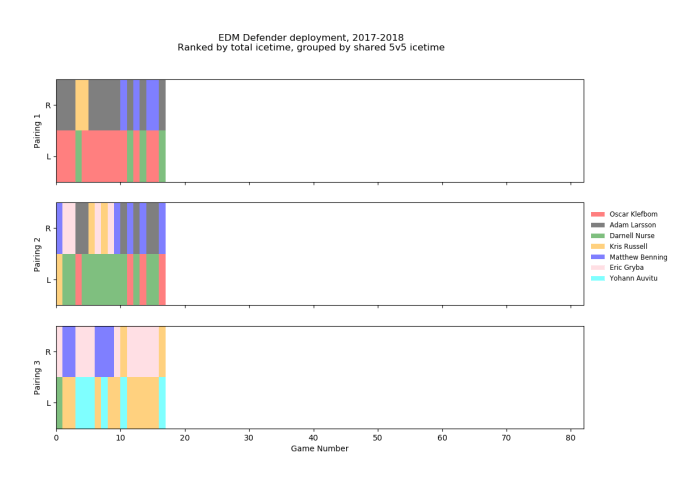
Source: Hockey Viz
While Klefbom’s ice time has dropped slightly, Klefbom still leads the Oilers when it comes to total ice time, and is second on the team at even-strength total ice time and average even-strength ice time per game. He may not be regulalry getting top pairing minutes, but he’s still a trusted a top four defenceman for the Oilers.
The reason’s for his struggles are unclear. We can point to his PDO, and hope that his on-ice shooting percentage and on-ice save percentage regress towards the mean. And that his on-ice goal share eventually aligns with his on-ice shot shares. But there’s something in his own shot-data that indicate that there might be more to his problems.
Starting at a high-level, Klefbom has personally taken 88 shot attempts over his 292 minutes of ice time at even-strength, a rate of 18.05 shot attempts per hour. This is a jump from his numbers last season when he took 12.05 shot attempts per hour, and currently places him fifth in the league among 168 defencemen who have played at least 150 minutes. Ahead of him are Brent Burns, who led the league in shots among all defencemen last season, as well as Dougie Hamilton, Johnny Boychuk and Roman Josi.
Now an increase in his shot attempts was somewhat expected. In the first week of the season, Klefbom did comment that he and the coaching staff wanted to get more shots on goal, setting a personal target of 250 shots (Source: EdmontonOilers.com). The problem for him is that while his rate of shot attempts are up, the percentage of his attempts that are becoming actual shots on goal are noticeably down. Last season, 55.5% of his shot attempts at even-strength became shots on goal. This season, less than 45.4% of his shot attempts have actually got on net. In fact, just a few games ago, his rate of shot attempts becoming shots was barely over 40%. To put things into context, over the last four seasons defencemen (>400 minutes of ice time) on average converted 45% of their shot attempts into shots on goal.
Another change from last season is the proportion of the team’s shot attempts that are coming from Klefbom’s stick. Last year, the Oilers generated 1,318 shot attempts with Klefbom on the ice at even-strength, with 22% of those shot attempts coming from his stick. This year, that proportion is up to 27%. Again looking at the last four seasons, defencemen typically had 16% of the shot attempts they were on the ice for.
The Oilers defence has visibly been far more active this year, quite regularly taking shots from the point. On more than a few occasions I’ve seen the Oilers defencemen (Klefbom and Nurse in particular) elect to shoot rather than make a pass that could open up another scoring opportunity. It’s definitely a different strategy from last season when more of the shots were coming from forwards, and I’d be curious to know why the coaching staff has made this change.
Now you can make the case that the Oilers have generated more shots and have played more aggresively as a team since they’ve trailed a lot this season. This is all part of score-effects, and it’s especially normal for defencemen to increase their own rate of shot attempts when their teams are trailing. Out of 208 defencemen last season who played at least 30 games, only 14 saw their individual rate of shot attempts drop more than 1 when their team was trailing compared to when their teams were tied.
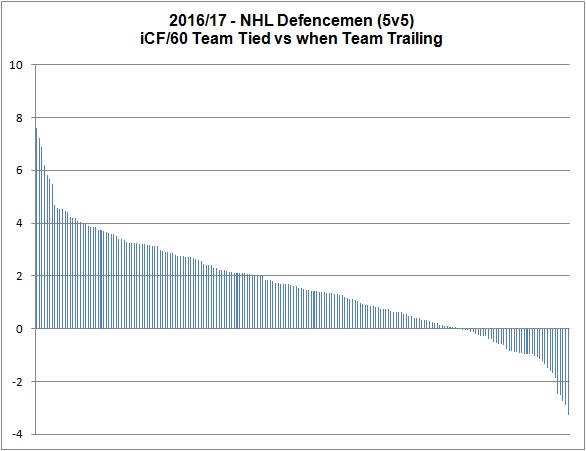
What’s surprising is that Klefbom’s rate of shot attempts this season actually drops when the Oilers are trailing. It’s a little odd considering he’s an offensive-minded defencemen with all-word talent, and should at least maintain the same level of shot attempts as when the score is tied.
| Season | iCF/60, Score Tied | iCF/60, Oilers Trailing | Difference |
| 2015/16 | 8.62 | 10.74 | 2.12 |
| 2016/17 | 13.77 | 12.87 | -0.9 |
| 2017/18 | 19.05 | 15.95 | -3.1 |
I suspect this might be more of a confidence thing for Klefbom – perhaps being the culprit when an early goal is scored against and then playing more conservatively to limit the chances of something bad happening again.
Whatever the case may be, it appears the Oilers are directing their defencemen a little differently this season, and it is showing up in Klefbom’s individual numbers. The hope would be that Klefbom’s on-ice goal-share starts to align with his on-ice shot share numbers, and we can focus on other areas of the team. The concern however is that the new tactics are having a negative impact on Klefbom’s play as he adjusts to being more of a volume shooter from the back-end. Definitely worth monitoring as the season progresses.
Data: Natural Stat Trick, Hockey Viz

What stats can never define for a defenseman is that critical read and react defensive action, be it positioning, gap control, hitting, poke check, etc in high danger situations. Oscar is struggling and has allowed a number of grad A chances some leading to GA, but I believe he will come around with some good coaching
Good analysis. I’m worried that this “everybody be Brent Burns” mentality is leading to fewer goals and fewer points for the D as a result. Todd loves that big D-bomb from the point but if the cross-seam is there, I don’t see the problem with going for it. Forwards have higher shooting percentages than D-men due to their inherent proximity to the net so why not create situations where they can shoot more?
this was not meant as a reply but as a post…
Pingback: Digging into Klefbom’s numbers at even-strength – Part II | The SuperFan