A short piece popped up on ESPN yesterday with the headline: Is Jack Eichel having a better season than Connor McDavid?
Before I go on, I have to clarify that I have no issues with Eichel and hope he goes on to have a fantastic career. He’s a prospect that we’ll hear lots about, considering he went second in the draft after McDavid, and also because he has the potential to be one of the NHL’s elite forwards. Anyone who appreciates offence and skill is going to be a fan of his game.
But is Eichel really having a better season than McDavid? My first instinct is no, mainly because I’ve watched McDavid excel this year and he’s been in the top 5 league-wide when it comes to scoring. And to be honest, I hadn’t heard a lot of noise about Eichel up until this point. So I was quite surprised to see the graphic ESPN had published.
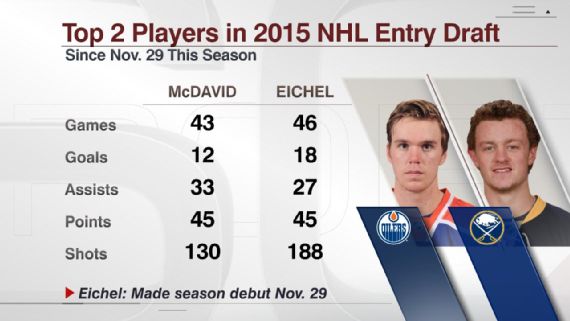
Source: ESPN
Appears that yes, both players are posting some great numbers since Eichel made his season debut on November 29th. But is Eichel really having a better season than McDavid? Let’s take a quick look.
First, let’s split out the even-strength (5v5) time to see how the two forwards have done when the game is in it’s natural state. Special teams play is assessed differently, which I’ll get to as well.
Here’s how both players have done since November 29, 2016.
| Metrics (5v5) | McDavid | Eichel |
| Games | 43 | 46 |
| TOI | 689.72 | 704.19 |
| G/A/P | 7-20-27 | 9-13-22 |
| Points/60 | 2.35 | 1.87 |
| Individual Shots For/60 | 8.35 | 10.91 |
| Individual xGoals/60 | 0.96 | 0.75 |
| Individual Scoring Chances For/60 | 3.57 | 1.70 |
| Individual Shooting% | 7.29 | 7.03 |
| Penalty Differential | +16 | +8 |
| On-ice Shooting% | 9.33 | 7.97 |
| On-ice Save% | 92.26 | 92.10 |
| PDO | 101.59 | 100.07 |
First thing that jumps out is that while both players have scored 45 points, 60% of McDavid’s have come at even-strength (27). Eichel on the other hand appears to be getting a larger share (51%) of his points on the powerplay, which has been excellent for the Sabres this season. McDavid is ahead of Eichel when it comes to even-strength points per 60 over this stretch, and is also well ahead when it comes to the rate of individual scoring chances. Worth noting that when it comes to primary points (i.e., goals and primary assists), McDavid has the slight edge over Eichel, 20-17. Neither player appears to be riding a significant PDO wave, so I’m confident that what we’ve seen from both players at 5v5 reflects their true talent.
Another way to assess both players is by looking at how their team has done across different metrics when they’re on the ice, versus when they’re off the ice. These are the five team metrics I’ll use:
- Corsi For% (CF%) – The proportion of all the shot attempts the team generated and allowed that the Oilers generated (i.e., Corsi For/(Corsi For + Corsi Against). This is used as a proxy for possession and can predict a team’s future share of goals.
- Fenwick For% (FF%) – The proportion of all the unblocked shot attempts the team generated and allowed that the Oilers generated (i.e., Fenwick For/(Fenwick For + Fenwick Against). This is used as a proxy for shot quality and considers shot blocking a repeatable skill. It can also predict a team’s future share of goals, slightlty better than Corsi.
- Scoring Chances For% (SCF%) – The proportion of all the scoring chances (as defined by Corsica Hockey) that the team generated and allowed that the Oilers generated (i.e., Scoring Chances For/(Scoring Chances For + Scoring Chances Against).
- Expected Goals For% (xGF%) – This is a weighting placed on every unblocked shot based on the probability of the shot becoming a goal. This depends on the type of shot, location and uses historical shot and goals data to come up with the probability for each unblocked shot. This has been found to be a better predictor of future goals than Corsi and Fenwick. (Detailed explanation can be found at Corsica Hockey)
- Goals For% (GF%) – The proportion of all the goals that the team scored and allowed that the Oilers generated (i.e., Goals For/(Goals For + Goals Against).
We know that McDavid has been lights out this season, and has really been the offensive driver for the Oilers. The team is one of the best in the league when McDavid is on the ice, but falls below average without him. The charts below reflect the games since November 29th.

I wasn’t expecting the Sabres to post the same type of numbers when Eichel has been on the ice, but I figured they would at least post a 50% shot-share and goal-share with him. And I assumed their play would drop off by at least a few percentage points without him on the ice. Turns out, I was wrong.
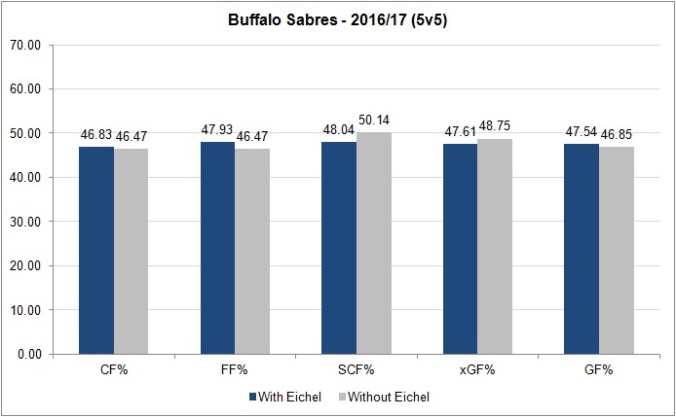
Across four of the five metrics, the Sabres have less than a 50% share with and without Eichel on the ice. And it appears based on the Scoring Chances and Expected Goals Share, that the Sabres get a slightly higher share without Eichel. There’s definitely more to the story, as we could assess who his linemates are, the competition he sees, what the defence pairings are like, etc. But for now, it’s difficult to convince me that Eichel is having a better season that McDavid.
Power Play
I wasn’t going to touch on special teams, but seeing that most of Eichel’s points this season are on the powerplay, it’s worth digging into to see how it has impacted the Sabres.
Since November 29th, at 5v4, the Sabres rank second (!) in the league when it comes to goals for per hour (7.82), while the Oilers rank fifth with 7.45. Both clubs have found success on the powerplay this season thanks in large part to their rate of shots per hour with the Oilers ranking fourth (53.95) and the Sabres ranking fifth (53.75).
And here’s how the two players compare at 5v4.
| Metrics (5v4) | McDavid | Eichel |
| Games | 41 | 44 |
| TOI | 106.13 | 143.75 |
| G/A/P | 2-7-9 | 8-9-17 |
| Points/60 | 5.09 | 7.10 |
| On-ice Shots For/60 | 60.49 | 62.19 |
| On-ice Goals For/60 | 8.48 | 9.60 |
| Individual Shots For/60 | 10.18 | 17.53 |
| Individual Shooting% | 11.11 | 19.05 |
Based on the numbers, it looks like the one area where Eichel is having more success than McDavid is on the powerplay. Eichel appears to be the shooter on his powerplay unit, getting a higher proportion of the shots he’s on the ice for, and generating 17.53 shots per hour himself. He’s also producing 7.10 points per hour, 3rd highest in the league among forwards, and is an increase from his previous season’s rate of 5.34. Impressive numbers, but we have to remember that McDavid plays a slightly different role for Edmonton, positioning himself on the ice as more of a playmaker. Regardless, both teams are benefiting from having their young stars on the ice at 5v4, and I think it’s safe to assume that it’ll continue.
Takeaway: While Eichel is putting together a pretty decent season, especially on the powerplay, it’s hard to argue that it’s been better than McDavid’s. This isn’t any sort of knock on Eichel; he’s a tremendous talent that will be an offensive driver for the Sabres. But until he posts better point rates at 5v5, and the Sabres post better shot and goal-shares with him on the ice, McDavid will remain the superior player.
Data: Corsica Hockey

McDavid doesn’t have wingers who are ripping it up. The reason Leon is on his wing is because Eberle has been less than average this season. This team really needs to find a sniper.
With RNH, Eberle and Lucic all having average or below seasons its really hurting McDavid.
If this team finishes 8th and has to play San Jose they might not win a game in the playoffs.
Next season priority, trade 1 of the 6 million dollar men for a winger that can score.