The Oilers Penalty Kill + Radio Spot (TSN 1260)

rnh-faceoff

Joined Lowetide this morning on TSN 1260 to talk Oilers. We touched on Sunday’s game in Nashville, the upcoming games in St. Louis and at home against Detroit, and what the Oilers should do heading into the deadline. Clip starts around the 25 minute mark.

One thing that we also touched on was the Oilers penalty kill, which was dreadful in Nashville and pretty much cost them the game, allowing three goals including the game winner.

The Oilers currently rank 23rd in the league when it comes to penalty kill efficiency with 80%. I find a more accurate method to assess a team’s penalty kill is goals against per 60 (GA/60), as team’s don’t play the same amount of time shorthanded. The Oilers have played 313 minutes at 4v5 so far this season, right around league average, and have allowed 32 goals and scored 3. In terms of goals against/60, the Oilers rank 19th in the league with 6.13, with the league average being 5.94.

This is a pretty big drop from where they were earlier in the season. From my analysis in November, the Oilers ranked 4th in the league with a 90.2% efficiency and allowed 3.54 goals per 60. I suspected at the time that their success was not going to be sustainable for two reasons: (1) they were allowing one of the highest rates of unblocked shots against, and (2) Talbot was posting a shorthanded save percentage above his career norms. To put it simply, their 90% penalty kill efficiency was not real.

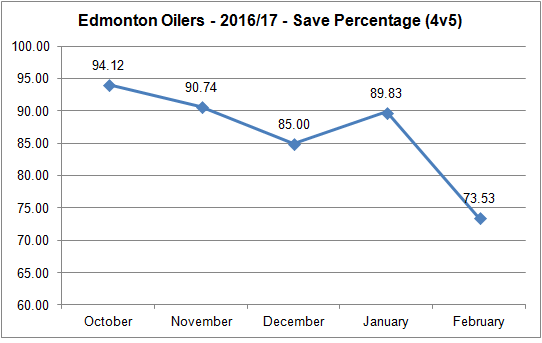
Fast forward to today, and the coaching staff still hasn’t figured out a way to slow down the opposing powerplays, as they rank 20th in the league with 69.13 unblocked shot attempts against per 60 (league average is 66.7). And they’ve been around this level pretty much all season. Their team save percentage, which was 93.55% in November and ranked third in the league, is now down to 17th with 87.60%, right around the league average.

What’s frustrating is that the Oilers failed to adjust their penalty kill when the warning signs were there in November. The team chose to stand-pat based on goal metrics that are poor predictors of future success, instead of looking at simple, publicly available, shot rates. Had they recognized early in the season that their penalty kill wasn’t real, they could have changed either their tactics, which is far, far too passive right now controlling zone entries and passing lanes, or the personnel they were deploying.

And now that they penalty kill has crashed back down to earth, and has cost them games, there’s a good chance the team will finally address it. Rather than being a proactive organization, the Oilers are in a reactive mode, and are likely to do something at the trade deadline when acquisition costs are fairly excessive and often volatile.

One specific thing the Oilers may seek out to improve their poor penalty kill is a faceoff specialist. The Oilers currently rank 24th in the league at 4v5 faceoff percentage with 42.3%, ahead of Arizona, Pittsburgh, NY Rangers, Los Angeles, San Jose and Winnipeg. The league average for faceoff percentage shorthanded is 45%.

Worth nothing that Los Angeles has the third worst faceoff percentage, but they have the second lowest rate of goals against and the third lowest rate of unblocked shots against.On the flip side, Colorado has the second best faceoff percentage at 4v5, but they rank 17th in the league when it comes to shots against and 24th when it comes to goals against. I’d have to dig in more to see the correlation between faceoffs and shots/goals against, but at first glance, I suspect it’s not as important as people might think. There are just so many other things a team can do to limit shots even after they lose a draw, whether it be play more aggressively (similar to what Carolina does) or have the right mix of players who can slow down the flow and movement of a powerplay unit.

Something else I want to point out is that the team was poor at faceoffs early in the season, but it never became a talking point because they were ranked near the top of the league in penalty kill efficiency and goals against/60 thanks to Talbot’s outstanding play.

Month GP TOI FA/60 GA/60 Save% Faceoff %
October 9 54.40 77.21 (28th) 3.31 (5th) 94.12 (4th) 36.92 (29th)
November 14 74.61 65.14 (11th) 4.02 (7th) 90.74 (7th) 43.24 (21st)
December 14 76.52 62.73 (12th) 7.06 (22nd) 85.00 (22nd) 46.15 (12th)
January 14 65.78 71.15 (20th) 5.47 (16th) 89.83 (8th) 46.58 (13th)
February 11 42.00 74.29 (21st) 12.86 (30th) 73.53 (30th) 34.15 (28th)
TOTAL 62 313.31 69.13 (20th) 6.13 (19th) 87.6 (17th) 42.3 (24th)

Above I have the Oilers penalty kill stats broken by month. In October, the club allowed the third highest rate of shots against, but still had the 5th best goals against per 60, riding on some very hot goaltending. Plus, they ranked 29th in the league when it came to faceoffs. Their rates of shots against did come down slightly in November and December, but it doesn’t appear to be impacted by their faceoff success.

If the Oilers are seriously wondering why the penalty kill is broken, they can start with two things. First, examine the team’s rate of unblocked shots against (FA/60), which has been above the league average pretty much all season. And second, review the team’s save percentage, which has taken a significant drop over the course of the season. This is likely related to overplaying Talbot because the team failed to address the back up position last summer.

20170227 - PK Save Percentage.png

Rather than focus on a penalty-killing face off specialist, the team is better off finding a suitable backup goalie to give Talbot a break. I think it’s fairly obvious in the penalty kill numbers that the Oilers starting netminder is in need of some help, and it really shouldn’t take a lot of assets to address considering how little value goalies have around the trade deadline. If the Oilers are adamant about faceoffs, call up Lander and be done with it.

The Oilers also need to review the personnel they’re deploying shorthanded, something I dug into last month. Really, players that tend to do better on the penalty kill in terms of limiting shots, including Pouliot and Lander and Larsson, should be getting more playing time, as the regulars including RNH (who has seen a massive jump in PK TOI since last season), Russell and Letestu, are not having much success. This really is on the coaching staff to figure out, and the fact that they’ve waited until the end of February to make adjustments is a little troubling.

Now I understand the penalty kill isn’t going to make or break a team’s season. But how the Oilers have managed their penalty kill this season, and their total disregard of the early season indicators,  has me wondering what other pieces of information they’ll ignore going forward. It’s become pretty obvious that they favor goal-based metrics to assess their team, which makes sense to a degree. But as we’ve seen now for a number of years, goal-based metrics are not good predictors of future success. I get the sense that if the club ever rode a wild PDO wave, similar to Colorado and Toronto in the past, the management group and coaching staff would assume that their success would be sustainable and make some poor, long-term decisions based on that. Good teams find ways to be successful, but also conduct proper evaluation, through the highs and lows of a season, to ensure their success is real and sustainable.

The end goal is to win the Stanley Cup, and to do that the team needs to establish an extended window, at least a five year term, where they can be legitimate, championship contenders. Every decision they make has to be geared towards this end goal, and it has to be based on the right information.

Data: Corsica Hockey

Connor McDavid for Hart

mcdavid-crosby2-jpg-size-custom-crop-1086x716
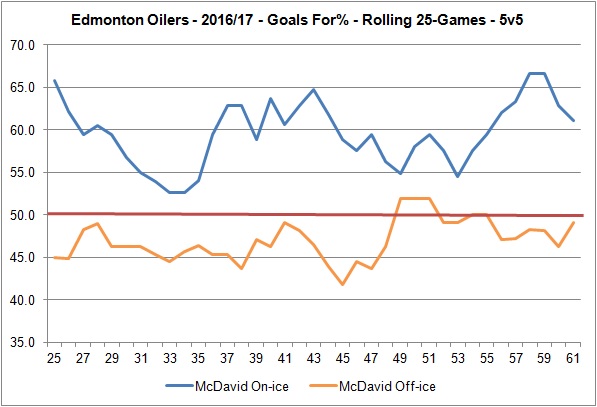
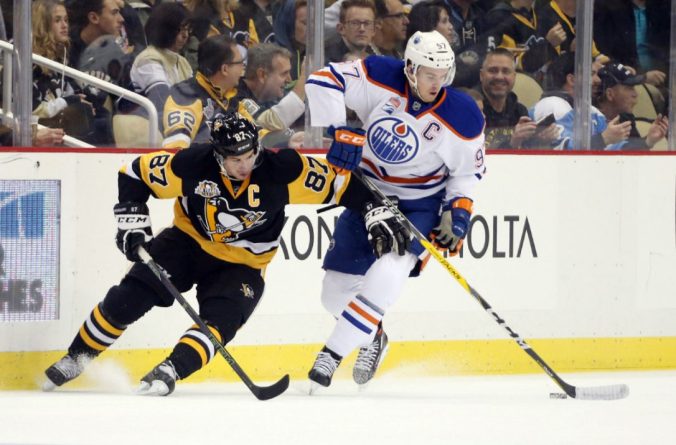
If the Hart Memorial Trophy really is about the “player judged most valuable to his team”, then it should be Connor McDavid winning it this summer.

You can make a case for a number of players to win it, including Sidney Crosby or Brent Burns. But in my mind, the award should go to McDavid, who has been carrying the Oilers all-season, and there are plenty of numbers to prove it.

As of this past weekend, here’s how the Oilers have done with McDavid on the ice and without McDavid at even-strength (5v5) this season. Before doing so, here are the five metrics I include in my analysis.

  • Corsi For% (CF%) – The proportion of all the shot attempts the team generated and allowed that the Oilers generated (i.e., Corsi For/(Corsi For + Corsi Against). This is used as a proxy for possession and can predict a team’s future share of goals.
  • Fenwick For% (FF%) – The proportion of all the unblocked shot attempts the team generated and allowed that the Oilers generated (i.e., Fenwick For/(Fenwick For + Fenwick Against). This is used as a proxy for shot quality and considers shot blocking a repeatable skill. It can also predict a team’s future share of goals, slightlty better than Corsi.
  • Scoring Chances For% (SCF%) – The proportion of all the scoring chances (as defined by Corsica Hockey) that the team generated and allowed that the Oilers generated (i.e., Scoring Chances For/(Scoring Chances For + Scoring Chances Against),
  • Expected Goals For% (xGF%) – This is a weighting placed on every unblocked shot based on the probability of the shot becoming a goal. This depends on the type of shot, location and uses historical shot and goals data to come up with the probability for each unblocked shot. This has been found to be a better predictor of future goals than Corsi and Fenwick. (Detailed explanation can be found at Corsica Hockey)
  • Goals For% (GF%) – The proportion of all the goals that the team scored and allowed that the Oilers generated (i.e., Goals For/(Goals For + Goals Against).

mvp-mcdavid

Here we see that with McDavid on the ice, the Oilers have at least a 50% share when it comes to all five metrics, which is expected considering his talent. His teammates tend to do better with him than without him, and he’s been the key driver of the Oilers offence this season. If the Oilers make the playoffs, it’ll be largely because of him. Without McDavid, the Oilers are mediocre at best as the club lacks secondary scoring, something that’s vital to have success in the playoffs.

That goal-share is what stands out the most. With him on the ice, the Oilers have a +17 goal differential, close to a 60% goal-share . Without him, the team has a -6 goal differential, a 47.8% goal-share, which would rank them in the bottom third of the league.

And here’s how the Pittsburgh Penguins have done with and without Sidney Crosby, arguably the best players in the world, this season.

mvp-crosby

As expected, the Penguins are outstanding with Crosby on the ice, posting a 53% share of the shot attempts, a 57% of the scoring chances and a  60%(!!) share of the goals. What’s amazing is that the Penguins still post incredible numbers even without the best player in the world, getting a 58.6% (!!) share of the total goals with Crosby on the bench. There is a drop off in the team’s outputs (i.e., shots, scoring chances, quality shots), but the Penguins still get at least a 50% share across the board.

And because of his offensive production this season, Brent Burns could also be a candidate for the trophy. Here’s how the Sharks have done this season with and without him.

mvp-burns

What’s interesting here is that the Sharks do better with him on the ice for most of the metrics, but it’s not as significant as McDavid or Crosby’s impact. What might draw attention, however, is the swing in goal share with Burns on the ice. With Burns, the Sharks have a goal-differential of +25 (63% goal share), and without him, they have a -5 differential (48% goal share). I suspect there’s more at play here, as the rest of the metrics only show a slight improvement with him on the ice (xGF%, share of quality shots, actually improves slightly without him). Regardless, a case can be made for the defenceman, but I don’t think his impact is as great as McDavid’s.

Takeaways:

  • The Oilers rely heavily on their young captain for offence, as they’re below a 50% share across all five metrics without him on the ice. The team is desperate need of offensive support on their second and third lines, and wouldn’t stand a chance if it weren’t for McDavid. He’s the MVP, the sole driver of offence, and his contributions, and ability to carry this franchise, should not be overlooked.
  • The Penguins are scary good right now. They’re second in the very competitive Metro division, with a +43 goal differential. They have success with and without Crosby, something not a lot of teams can do, and will be competing for the Cup. Top teams figure out a way to keep their best players to sustain success, and the Penguins are the best example of that.
  • This is by no means a knock on Crosby. If he wins the award, it’ll be well deserved. But if the award is about the player most valuable to his team, then it has to be McDavid. The Oilers aren’t the same team without him, and would be looking at the draft lottery if it weren’t for their captain.

Data: Corsica Hockey

The Oilers Secondary Scoring Isn’t Getting Better

A key concern for the Oilers this season has been their inability to generate offence when McDavid is not on the ice. After 61 games, the Oilers rank 9th in the league, and 4th in the west, when it comes to goal-share at even-strength (5v5) play with 52.7%. With McDavid on the ice, the Oilers have outscored their opponents 52-34, a fantastic goals-for percentage of 60.5%. Without him, however, the team has been outscored 71-65, which translates to a 47.8% goal-share. While the club continues to do well as a whole, it’s largely riding on the shoulders of their young captain.

Here’s how the team’s goal-share has trended this season, broken out into 25-game, rolling segments. With McDavid on the ice, the team’s share of the total goals has typically been above 55%, which isn’t surprising considering his ridiculous skill and ability to generate offence. Without him, the team’s share of goals was initially pretty steady around the 45% mark over the first two months of the season, and that number has gradually increased towards the 50% mark over December and January as the other lines finally started producing goals. It’s worth noting that the team’s shooting percentage without McDavid on the ice was around 6.5% early on in the season, but that has since moved up to 7.5% in the more recent stretch of twenty five games.

20170224-gf97

So by the looks of it, things appear to be getting better for the team without McDavid on the ice. However, when we look at the team’s share of shot attempts and how that has trended over the course of the season, we see that the improved goal-share may not exactly be sustainable. The club currently ranks 17th in the league when it comes to Corsi For% with 50.2%, a rather discouraging drop considering they ranked in the top 10 in the league at one point. With McDavid on the ice, the Oilers are golden with a Corsi For% of 54.2%; without him on the ice, that number drops down to 48.1%.

20170224-cf97

If we look at the 25-game rolling segments of shot-share, we actually see that there’s been a gradual decline without McDavid on the ice, with the team having posted a very troubling 45% Corsi For% over the last 25 games (which is since the end of December).

Full article is at The Copper & Blue.

The Oilers Powerplay is Good

With the trade deadline approaching, the Oilers will have the chance to make some key decisions that can not only impact their push for the playoffs, but also their long term goal of building a championship contender. It’ll be important for the Oilers to retain, and possibly acquire more draft picks and prospects, as those will be critical building blocks moving forward.

The Oilers could address a number of existing weaknesses, including the center and right-wing depth up front, as well as their back-up goalie position. One could also make the case that the team should look to add an offensive defenceman to improve the defence core and potentially quarterback the powerplay. But as General Manager Peter Chiarelli indicated earlier this week, that might not be high on the priorty list.

Yes it’d be nice to have a pure powerplay d-man but I’ve been satisfied with [Andrej Sekera and Oscar Klefbom] on their respective units. Yes we could always improve our powerplay, is that the solution? It’s one of them but that’s certainly not on my shopping list this trade deadline. [On follow-up question as to how expensive it might be] You saw what it took to get a Top Four right-handed D [Adam Larsson] and you can extrapolate from there. (Source: Cult of Hockey, Edmonton Journal)

One area that the team has done well in this season is their overall powerplay. Now, looking at their efficiency with the man advantage, typically recited on game broadcasts and posted at NHL.com, the team ranks 12th in the league with 20.4%. But, if you look at the actual goal scoring rate, as in how many powerplay goals they get per 60 minutes of powerplay time, they’re first in the western conference and sixth in the league with 6.85 goals.

powerplay-rolling-ff60-and-gf60

Full article is at The Copper & Blue.

Talking Oilers on the CBC Edmonton News (TV)

sunilcbc201701214

Joined Adrienne Pan on the CBC Edmonton News this evening to talk all things Oilers. Full clip is here, starting around the 17:50 mark.

We covered quite a bit including the Oilers struggles since the all-star break, collecting only one win in the past five games. We also talked about the goal-scoring slump, only three goals at even-strength, and how they’ve done at different score-states this season. In case you missed it, I wrote a piece on this topic last week over at The Copper & Blue.

I also brought up the team’s declining shot rates and shared my thoughts on what the line combinations should be. As for the powerplay, which has only scored once over the past five games, I’m not too worried as they still rank in the top 10 when it comes to shot generation.

We also touched on the trade deadline and the possibility of adding a rental type player like Brian Boyle. Really not a fan of the player, and feel the team needs to focus on building a contender and retain picks and prospects.

One thing we didn’t touch on was how tough the rest of the month is going to be. Two home games that the team should be able to get at least 3 points from this week. And then after that it’s six games in eleven nights starting in Chicago, and then a back to back set against Florida and Tampa Bay. One day off, and then three games in five nights, all against good, experienced teams (Washington, Nashville, St. Louis). March is going to be a lot lighter, with 13 of the 15 games at home. Only one back to back set in March and it’s on the road in Anaheim and Colorado. But for the rest of the games in March, they’ll be rested and taking on a few teams that are on the second half of back to backs. Finish February with a 50% points percentage, and a healthy roster (McDavid, Talbot, Sekera) and I think the Oilers have an excellent chance of making the playoffs.


The Oilers in Different Score-States

The Edmonton Oilers are sitting in a great spot right now as the club has an even-strength (5v5) goal-share of 52.28%, having outscored opponents 102-94, which ranks them 11th in the league, and 5th in the Western conference. The Oilers PDO isn’t anything out of the ordinary as the team is relying on league average goaltending and has had a normal team save percentage over the course of the year. This is good news and suggests that the team’s goal production should be sustainable, as long as their top players, including McDavid, Talbot and Sekera, stay healthy.

What’s interesting is at what score-state (i.e., tie game, Oilers trailing, Oilers leading) the Oilers are scoring their goals. According to Travis Yost’s analysis over at TSN, the Oilers are a much more dominant team when they’re trailing in a game, as they run at a goal-scoring rate of 3.11 goals per hour, and have outscored opponents 42-21, which translates into the second best goal-share in the league with 66.67%. It’s definitely encouraging to see that the team has the ability to turn up the offence, however it’s a bit alarming that  the Oilers play so poorly when the score has been tied this season.

Score State (5v5) Goals For% Goals For/60 Corsi For% Corsi For/60
All Scores 52.28% 2.35 50.52% 55.51
Tied 38.75% 1.74 48.58% 54.78
Trailing 66.67% 3.11 59.18% 62.93
Leading 55.56% 2.42 44.22% 48.47

With the score tied, the Oilers have a 48.58% share of the total shot attempts (Corsi For%), which, along with their 54.78 shot attempts per hour, ranks them 22nd in the league. And in this score state, the Oilers have been outscored 49-31, which translates into the second worst goal share of 38.75%, only ahead of the Colorado Avalanche. Their 1.74 goals per 60 ranks them 26th in the league.

To get a sense of what might be going on here, it’s important to look at how the Oilers do with and without McDavid, who has been the team’s offensive driver all season. My initial thought was when the score has been tied, the team still does great with McDavid and does really poorly without him. But if we split out the numbers, we see that’s not exactly the case.

oilers-defencemen-toi-prop-by-score-state

Full article is at The Copper & Blue.

Finding Offence

With only four goals in their last five games, it appears that the Oilers might be having some scoring issues at even-strength. The good news is that the team still ranks 9th in the league when it comes to goal-share, as they’ve outscored opponents 103-94. And they rank 11th in the league when it comes to their goal-scoring rate, sitting just above the league average with 2.35 goals per hour at even-strength (5v5).

League Rank Team Goals For% Goals For/60
1 Pittsburgh 56.54 3.03
2 Washington 65.26 3.02
3 Minnesota 60.40 2.97
4 Toronto 50.94 2.76
5 Columbus 55.28 2.72
6 NY Islanders 52.15 2.72
7 NY Rangers 52.07 2.71
8 Montreal 56.68 2.50
9 Detroit 50.00 2.43
10 Nashville 53.59 2.40
11 Edmonton 52.28 2.35

The Oilers offensive outputs have been a big improvement from years past as the clubs rate of goal scoring was typically below the league average and often near the bottom of the league.

Data: Corsica Hockey

What’s also been encouraging is that over the course of the season, the Oilers rate of goal scoring has remained pretty steady, even up until now. Over the past 25 games, the team has seen their rate of goal production dip just below the league average of 2.31, but it doesn’t appear here, at first glance, that there are major issues.

Data: Corsica Hockey

Now a big reason for the Oilers offensive output this season has of course been Connor McDavid. When he’s been on the ice, the Oilers create a lot more offence and scoring chances, and have generated 3.11 goals per hour. Without him on the ice, the Oilers rate of goal scoring drops significantly to only 1.96 goals per hour, which is around what Buffalo (1.96), Arizona (1.91) and New Jersey (1.91) are currently generating as a team this season. It doesn’t help that the Oiler forwards paid to generate offence are struggling all at the same time. Players including Milan Lucic, Jordan Eberle, Ryan Nugent-Hopkins and Benoit Pouliot, all of which are experienced NHL players with past success, are below their historical averages when it comes to goal scoring and point production. If the Oilers intend on being a playoff team, with championship aspirations, they will need to find a way to generate more goals, especially with McDavid on the bench.

Full article is at The Copper & Blue.

Finding Help at Center

hanzal
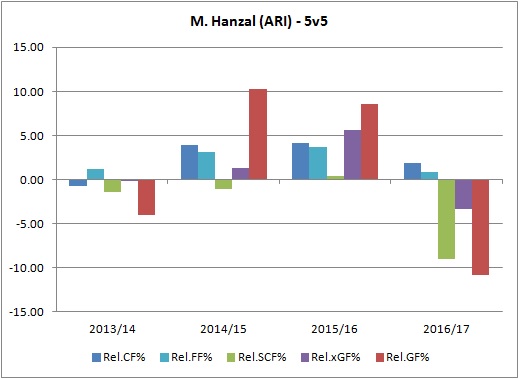
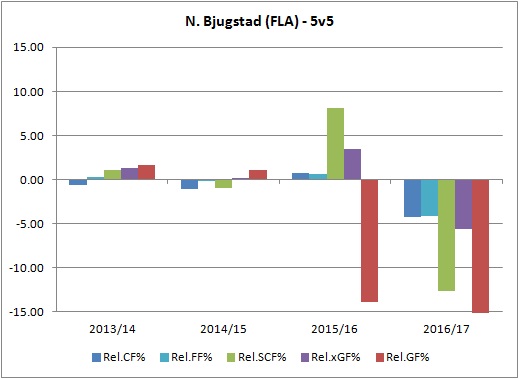
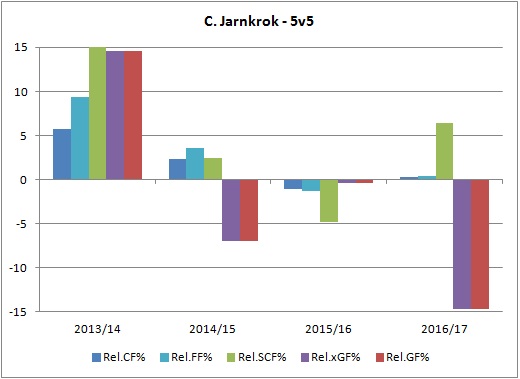
An area on the roster that the Oilers could look to improve on is their center depth. With Draisaitl getting an extended stint on the top line with McDavid, there is a bit of a weakness as their current third liner is a rookie and ranks last on the team in points/60.

One player that will get some attention at the deadline is 29 year old centerman Martin Hanzal. He’ll be an unrestricted free agent this summer, and with Arizona having been out of playoff race for a while now, the club will likely try to acquire picks and prospects for him. He’s coming off of a 5-year, $15.5 deal ($3.1 million AAV)

A quick glance at his numbers and relative-to-team stats tells us he’s a top six player that improves the teams overall play when he’s on the ice. He’s been pretty consistent over the last four years when it comes to shot rates and point production. This season, he’s seen his points/60 rate drop, which could be due to his on-ice shooting percentage drop from 9.04% to 5.86%, and his overall PDO is down to 96.57. What’s interesting is that his own individual shot rates (iSF/60) and individual shooting percentage (iSH%) are fairly close to his historical numbers, which makes me think his linemates are letting him down. Just a hunch at this point.

Season 2013/14 2014/15 2015/16 2016/17
GP 65 37 64 42
TOI 873.1 493.77 792.78 552.53
G-A-P 10-15-25 6-11-17 9-16-25 6-3-9
P60 1.72 2.07 1.89 0.98
iSF60 8.32 7.17 7.49 7.71
iSh% 8.26 10.17 9.09 8.45
Sh% 6.37 9.75 9.04 5.86
Sv% 92.54 89.27 92.84 90.71
PDO 98.91 99.02 101.88 96.57

Here’s how his relative to team stats look like. I’ve included Corsi, Fenwick, Scoring Chances, Expected Goals and Goals at 5v5.

hanzalrel

Now while Hanzal would be a fine rental for a playoff bound team looking to add depth, I don’t think it makes a lot of sense for the Oilers.

First, the Oilers really can’t afford to send away picks or prospects as their talent pool is quite shallow at this point. Second, the Oilers have to fill a few more holes on their roster before they can consider themselves legitimate Stanley Cup contenders. Now Hanzal could give their team a boost, but I doubt it’ll be enough to get out of the first round against San Jose or Anaheim. He’s also a left shooting player, something the Oilers have an abundance of, both up front and on defence. The other issue too is that Hanzal would cost a lot to retain. He’s 29 and coming off of a contract that paid $3.1 million per season. This will be his last chance to cash in, and you can bet a team will pay for an experienced centerman with size and good underlying numbers.

Now if the Oilers were actually interested in acquiring Hanzal at the deadline AND retaining him, they would have to move out one of the existing, heavy contracts and play him higher up in the roster to justify the deal. Really, this only makes sense if RNH is on the way out, and a cheaper third-line option was coming in. Again, the Oilers would be paying Hanzal significant dollars, which won’t make sense as he’s likely past his prime at this point.

Now, if the Oilers did want to add a centerman and were okay with paying him less than $4 million per season, they should probably consider someone younger who may be undervalued by the market. One player that could make sense is Nick Bjugstad of the Panthers. He’s 24, has size, shoots right and has four more years left on his deal that pays him $4.1 million per season. Issue for him is that he’s been dealing with injuries, and the Panthers have Barkov (21, $5.9 million per season until 2022) and Trocheck (23, $4.75 million per season until 2022) playing center ahead of him right now.

Season 2013/14 2014/15 2015/16 2016/17
GP 76 72 67 23
TOI 980.62 917.19 810.09 253.11
G-A-P 15-18-33 13-14-27 9-8-17 1-1-2
P60 2.02 1.77 1.26 0.47
iSF60 9.06 9.94 8.52 7.35
iSh% 10.14 8.55 7.83 3.23
Sh% 7.95 7.11 7.23 1.45
Sv% 90.68 92.05 91.18 93.29
PDO 98.63 99.17 98.41 94.74

Bjugstad’s PDO is just abysmally low right now, and it’s hard to say what his career averages truly are. His individual and on-ice shooting percentages are the lowest on his team, and I suspect it’s a mix of his injuries derailing his season and his teammates that are impacting things.

bjugstadrel

The Oilers would be taking more of a risk with acquiring Bjugstad than with Hanzal, but the team would at least get Bjugstad in his prime. I don’t think this player is as bad as his numbers are this season, and would think he’ll get back to more respectable numbers eventually.

Another player that the Oilers could look at is Calle Jarnkrok, a 25 year old center, right shot, who is signed with Nashville for $2 million per season for the next five seasons after this one. His numbers are down slightly, which could be impacted by his poor on ice save percentage and slightly lower than average on ice shooting percentage. He doesn’t appear to be much of a volume shooter, but he can still contribute in a depth role.

Season 2013/14 2014/15 2015/16 2016/17
GP 12 74 81 51
TOI 141.21 791.45 1023.79 580.66
G-A-P 2-6-8 7-10-17 11-12-23 6-5-11
P60 3.4 1.29 1.35 1.14
iSF60 5.1 6.82 5.86 7.23
iSh% 16.67 7.78 11 8.57
Sh% 16.42 6.57 7.34 6.62
Sv% 93.1 92.47 91.82 90.31
PDO 109.52 99.04 99.16 96.93

jarnkrokrel

Jarnkrok is a little older, and he’s signed until he’s 30 at a very, very reasonable deal. The issue for the Preds is that they may not be able to protect him for the upcoming expansion draft as they have a core of defenceman worth protecting and have some no movement clauses for some of their forwards. Vegas would likely take Jarnkrok if he’s available, so it might in Nashville’s best interest to get something for him before they have to expose him.

Every move the Oilers make has to be geared towards winning the cup. With a need at center, the Oilers could get a rental like Hanzal at the deadline, but it would be in their best interest to find a reasonably priced contract for a player that is still in his prime. The objective has to be establishing a long term window where the team can be a legitimate championship contender. It makes little sense dealing away picks for temporary help when those assets could be put towards players that can help for the long run. And the Oilers have to take advantage of teams that may need to shed salary or ones that are in a tough spot because of the expansion draft.

Data: Corsica Hockey, Cap Friendly

Trading Kris Russell

With the NHL trade deadline one month away, the Oilers will have a chance to make some important decisions that could impact their short term goal of qualifying for the 2017 playoffs and the long term goal of establishing a window where they can be legitimate Stanley Cupcontenders.

In terms of short term needs, the Oilers could use an upgrade to their center depth as well as their right side up front. There’s also an obvious need when it comes to goaltending as Cam Talbot, who has arguably been the Oilers MVP, does not have a reliable backup that can give him a night off from time to time. There’s also a case to be made that the team could use an offensive defenceman to support the powerplay, but the team should probably refrain from spending significant assets to acquire. The issue for the Oilers is that they don’t have a lot to give up, as their own prospect pool isn’t very deep and the picks they have for the upcoming draft are needed to replenish it.

The Oilers do have veteran players like Benoit Pouliot and Matt Hendricks that could draw some attention at the deadline, but the Oilers are not likely to acquire significant pieces by moving either of these two. Both have struggled this season, although Pouliot does have a history of contributing to a team’s offence and could provide a team with skill and experience in a top six role.

Where the Oilers could tap into to address their short term and long term goals is their defence. For the first time in a long time, the Oilers have an NHL-calibre defence core, with Andrej Sekera, Oscar Klefbom and Adam Larsson signed with the team for the next four years on reasonable contracts. Add to that core Brandon Davidson, Darnell Nurse and Matt Benning, players that will be under team control for a while, and the Oilers have a group that should provide stability on the back end.

This brings us to Kris Russell who was signed by the Oilers to a one-year deal just days before the start of the 2016/17 regular season. Serving as a well-priced stop-gap, having Russell on the roster allowed the Oilers to keep some of their defensive prospects like Griffin Reinhart and Jordan Oesterle in the AHL to continue their own development. The Oilers have been able to rely on Russell quite heavily, as he’s led the team in average ice time per game and has a respectable goal-share of 51.6%. He has spent a significant amount of time with Connor McDavid this season, which would help his numbers, and he’s also been benefiting from a 94% save percentage when he’s on the ice for most of the season, which is not exactly sustainable.

We also know that a team or players on-ice goal-share is not a good predictor of future success, so we look at the share of shot attempts which correlates better with future goal-share. Russell currently ranks last on the team among defencemen when it comes to on-ice Corsi For% (score and venue adjusted) at even-strength (5v5), as the team has had 46.55% of all of the shot attempts with him on the ice. When he’s not on the ice, the Oilers have a Corsi For% of 52.37%, which is a significant jump. Now it can be expected that the share of shot attempts would improve when Russell isn’t on the ice as he has faced better competition, but it should not increase that significantly. For instance, when Adam Larsson, who has also been playing top lines, is on the ice, the team has a 50.31% share of all of the shot attempts. That share increases only slightly when Larsson is on the bench, going up to 51.52%.

russellwowycf-0

Full article is at The Copper & Blue.