 It’s funny how the human memory works. Between the mid-nineties and the 2006 Cup run, the Oilers were a decent team that would barely squeak into the playoffs and typically get eliminated in the first round. It was frustrating as a fan since the Oilers couldn’t compete with other clubs financially and were typically eliminated early on in the playoffs. The Oilers weren’t good enough to win the Cup and not bad enough to pick higher in the draft.
Now with the Oilers completely lost in the abyss, and on their way to a ninth straight season out of the playoffs, this previous era doesn’t seem so bad. Over a span of nine seasons (1996-2006), the Oilers made the playoffs seven times. They had complete rosters, with centers, goalies and yes, even defencemen! Sure they often made the playoffs because another team sputtered down the stretch, but they would make it nonetheless.
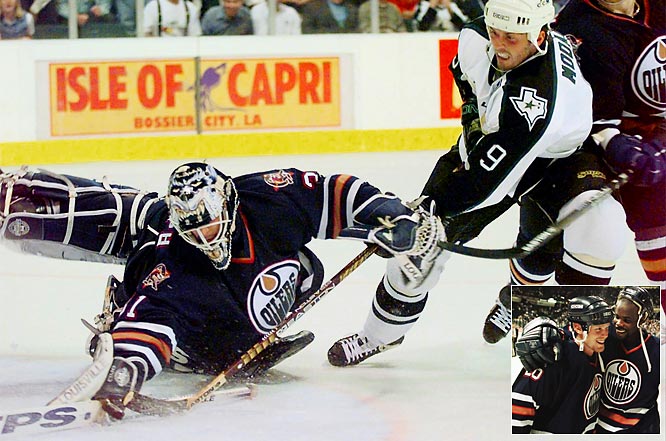
The 1996-1997 team stands out for me for two reasons: it was the first season where I actually followed the Oilers; and it was the club that broke the four year playoff drought and upset the Stars in the first round. The team was made up of pretty decent players: Doug Weight, Jason Arnott, Ryan Smyth, Mike Grier, Todd Marchant, Boris Mironov and of course Curtis Joseph. A lot of young players that the team had acquired through trades during the playoff drought. Based on the player’s production and the team’s success, the Oilers management team was clearly doing something right with their player evaluations and making the most of a limited payroll.
It’s no surprise that when the Oilers were getting a fair share of the shots and got decent goaltending, the Oilers had a decent chance of making the playoffs. What these shot differential numbers show is that there was a distinct “Golden Era” when the Oilers were competitive. Worth noting that the two seasons that the Oilers missed the playoffs (2001-02 and 2003-04), the club was outshooting opponents at a decent clip and getting good goaltending. Them the breaks, I guess.

Edmonton Oilers (1990-2014)
The Oilers have clearly shifted their philosophy on how they evaluate players. Looking at defencemen alone, between 1996 and 2006, the Oilers acquired the following players by trade: Roman Hamrlik, Janne Niinimaa, Jason Smith, Igor Ulanov, Eric Brewer, Steve Staios, Jaroslav Spacek and Chris Pronger. These players had been developed elsewhere and the Oilers made some very savvy trades to get them around their primes. The Oilers have not even come close to replicating that kind of success when building a blue line, instead deploying rookies and aging veterans since 2006.
Edmonton Oilers (1990-2014)
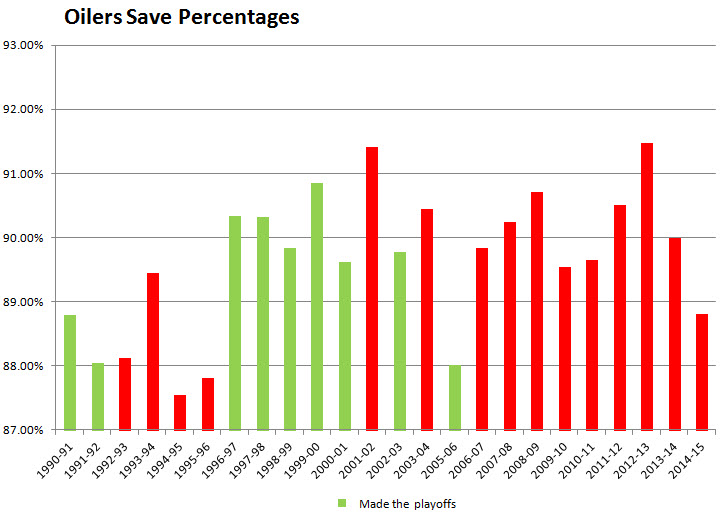
Worth noting that Curtis Joseph was a big reason why the Oilers made the playoffs even when the team was getting outshot in 1996. Joseph left after only two seasons, but the Oilers replaced him with Tommy Salo (via trade in 1998) and got good production from the Swede until 2003. Since 2006, the Oilers have had pretty reasonable team save percentages but have unfortunately been getting outshot at a ridiculous pace.
For a team that’s been in a nine year drought, the Oilers have very little to show for it. The draft record speaks for itself, but the Oilers have also made very few trades for developed/developing prospects who could help in the next year or two. Since the 2006 run, the Oilers appear to have focused more on spending money than on actual evaluations. They signed Sheldon Souray and Shawn Horcoff to big contracts and pursued players like Marian Hossa, Dany Heatley and recently, David Clarkson.
Any thoughts, let me know. You can also access the table I put together here: Edmonton Oilers – Historical – December 2014.
Sources:

Thanks for creating this spreadsheet! Awesome to see the this kind of historical data.
I do have one small favour to ask. Could you re-do the save percentage chart to highlight the differences between the years? If you started the plot around 87% and stopped around 93% it would show the differences more clearly.
Thanks again for posting the data.
Done! Thanks for the feedback.
Pingback: Thoughts on the Oilers: Shot differentials under Nelson; Keeping Fasth; Pre-Pronger Era | The SuperFan
Pingback: Talking Oilers, player development and defence rosters on Lowdown with Lowetide | The SuperFan
Pingback: The SuperFan Podcast – Episode 1 | The SuperFan
Pingback: The SuperFan Podcast – Episode 12 – Rex Codex Libris (@CodexRex) | The SuperFan