Trepidation

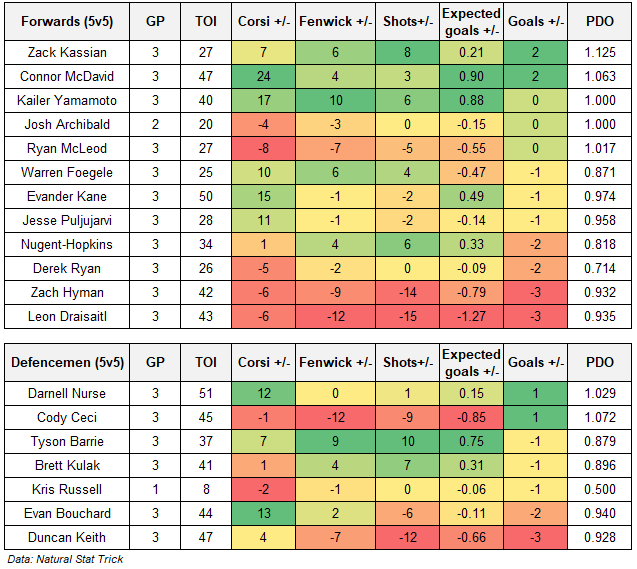
Ahead of such a high-pressure regular season where the Oilers are expected to contend for the cup, there remains a few question marks across the roster. Up front the Oilers have the high end talent needed to win championships, but it remains to be seen if the rest of the group can consistently outscore opponents when McDavid isn’t on the ice. And on the blue line, things are looking alright with a top four that should be able to hold its own in the Pacific, although no major game breakers exist on the backend like some of the top teams have – unless of course Bouchard takes another step. But as long as the defence core and the top end stars stay healthy, and a couple youngsters emerge as reliable options, a playoff berth should be achievable.

The biggest concern heading into the regular season is in net with 30-year old Jack Campbell starting the first season of a five-year contract. While he should be a more stable option than someone like Mike Smith, his recent numbers have been pretty similar to those posted by the ‘battler’. So it’s unclear if Campbell is really going to be an upgrade.

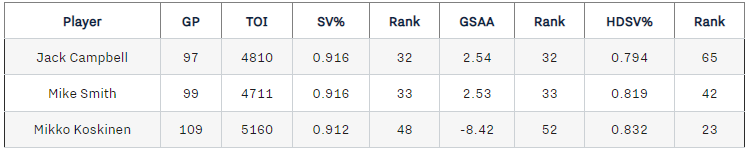
Over the last three seasons, Campbell has been right around league average posting a 0.916 save percentage at even-strength, which ranks 32nd among 68 goalies who have played at least 2,000 minutes (~42 games). He also posted a +2.54 goals saved above average (GSAA), which ranks 32nd in the same cohort. For reference, Mike Smith was right behind Campbell, ranking 33rd with a 0.916 save percentage at even-strength and 33rd when it comes to GSAA with +2.53. Worth noting too that Mike Smith was a better goalie when it came to high danger chances, posting a 0.819 high-danger save percentage (HDSV%) ranking 42nd, while Campbell ranked 65th among 68 goalies with a 0.794 save percentage.

Even-strength (2019-2022)

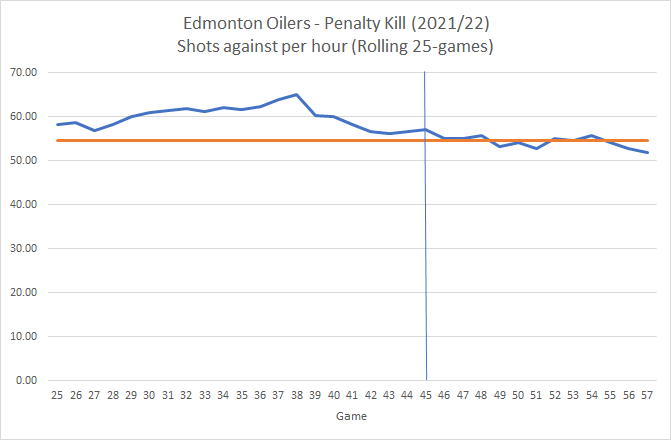
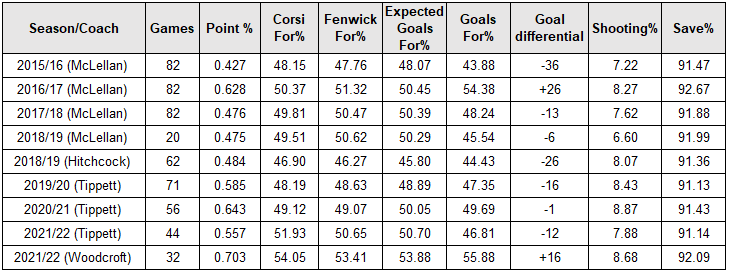
And on the penalty kill is where Smith has posted better numbers than Campbell. In the last three seasons, Campbell posted a save percentage of 0.881, which ranked 14th among 66 goalies who played at least 200 shorthanded minutes (~42 games). Smith on the other hand was one of the best goalies in the league, ranking second in the group with a 0.902 save percentage and tied with the Rangers Igor Shesterkin. With the Oilers consistently allowing one of the highest rate of shots against on the penalty kill, both under Tippett and Woodcroft, Smith really bailed the team out posting a +16.47 goals saved above average shorthanded, second only to Shesterkin.

Penalty kill (2019-2022)

The other issue worth monitoring is how well Campbell handles the workload in Edmonton, which will be slightly higher than what he was used to in Toronto as the Oilers do tend to play more of a free flowing game and willing to exchange scoring chances. Over the last three seasons under head coach Sheldon Keefe, the Leafs allowed one of the lowest rates of shots against in the league at even-strength with 28.55, and allowed 39.52 unblocked shot attempts against (i.e., Fenwick). Under either Woodcroft or Tippett, the Oilers were slightly higher than that and closer to league average levels, allowing about 30 shots against per hour and just over 41 unblocked shot attempts.

That’s not too bad of a difference and it’ll be interesting to see if the Oilers can improve their defensive play. But it’s on the penalty kill where things could get a little rough for Campbell. Over the last three seasons in Toronto under Keefe, Campbell’s teammates allowed 64.51 unblocked shot attempts per hour when shorthanded and 47.38 shots against per hour – numbers much stronger than league average levels. The Oilers on the other hand have been fairly poor on the penalty kill allowing 77.80 unblocked shot attempts against per hour and 56.69 shots against per hour over the last three seasons. Those numbers actually got worse when Woodcroft took over with the Oilers allowing 81.65 unblocked shot attempts against per hour and 59.63 shots against per hour after the coaching change in February 2022. As mentioned above, the Oilers goaltending really bailed out the penalty kill and masked some of the underlying tactical issues. Now it remains to be seen if Campbell can do the same, all while adjusting to a new team and system.

We’ve seen a few goalies in recent years now make their debuts with new teams following success elsewhere and falling flat. Jacob Markstrom was the Flames big off-season signing in 2020 following a career year in Vancouver, but saw his numbers take a hit as he adjusted to new teammates and a new system. And the Flames ended up missing the playoffs that season. Philipp Grubauer was another goalie who had posted solid numbers in Washington and Colorado, was even a Vezina trophy finalist, before signing with Seattle in 2021. But he too struggled adjusting to a new system, and the Kraken ended up finishing last in the Pacific. Considering both goalies were roughly the same age as Campbell when they moved to new teams and had similar pressures to live up to new multi million dollar contracts, you can understand why there might be some trepidation with the Oilers goaltending this upcoming season.

Data: Natural Stat Trick

Also posted at The Copper & Blue.

Forecasting Leon Draisaitl’s 2022-23

Expectations are going to be high for the Edmonton Oilers as the club attempts to meet and hopefully exceed the results from last season. Make no mistake, winning a round, and hopefully two, is the only way to really justify this management group’s roster construction and asset management this off-season. To be one of the top end teams in the league is going to require consistently outscoring opponents, and having a 50 goal scorer or two is going to help – especially when the rest of the roster has had issues producing in the past without one of the top end stars on the ice.

When it comes to Leon Draisaitl, there’s a fairly good chance he’ll continue producing at the rate he’s been at over the last few seasons. He’s clearly in his prime, has done well staying healthy and has put up 304 all-situation points in 207 games over the last three seasons. That’s second only behind Connor McDavid (325 points) and 50 points ahead of third place Jonathan Huberdeau (254 points). Feels like 100 points is a reasonable target for the 24-year old, and there’s a good chance he’ll surpass that.

But what about actual goals? Is it safe to assume he can reach the 50-goal mark next season? Can we can expect him to surpass that again? Could he even hit 60 and help the Oilers reach the 300 goal mark like five other teams did last season? It’s a lofty goal for the German forward as it’s been accompllished only three times in recent memory: Auston Mathews in 2021/22 (60 goals), Steven Stamkos in 2011/12 (60 goals) and Alexander Ovechkin in 2007/08 (65 goals).

For this exercise, I’m keeping things relatively simple. I’m going to project how many games Draisaitl will play in 2022/23, and then using his average rate of shots on goal per game at even-strength and the powerplay as well as his shooting percentages over the last three seasons, determine how many goals he’ll likely score next season. From there we can figure out what he and the Oilers can do to improve his odds of scoring 60 goals.

First, a summary of the number of goals Draisaitl has scored each season that he’s been in the league, with a breakdown of goals by the various game-states: even-strength, powerplay and penalty kill.

So what’s a reasonable target for Draisaitl next season?

Let’s start with even-strength where Draisaitl has scored 72 goals from 410 shots over the last three seasons, posting a 17.56% shooting percentage – one of the best in the league.

If he plays in 97% of the games this upcoming season (which is the proportion of games he’s played in since his first full season in the league), so about 80 games, and generates 1.95 shots per game, which is what he’s averaged over the last few seasons – he should get about 155 shots on goal at even-strength. And if he posts the same shooting percentage he’s had over the last three seasons (17.56%), he should score about 27 even-strength goals. Now if he can match his career high shooting percentage of 20.53% which he did in the 2018/19 season, he could potentially score 31 – slightly better than what he posted last season.

On special teams, I think we can reasonably expect about 22 powerplay goals from Draisaitl next season. Table below is a summary of his powerplay history.

Based on the rate of shots he’s posted on the powerplay over the last three seasons (1.17 shots per game), he’ll likely get about 93 shots on goal. And if he converts on 23.50% percent of those shots, which has been his shooting percentage over the last three seasons, he’ll get about 22 goals. If he somehow matches the 25.81% powerplay shooting percentage that he posted in the 2019/20 season, he could get to 24 goals matching his powerplay total from last season. And since he’s scored a short-handed goal in each of the last two seasons, and actually scored three times in 2018/19, I think we can expect a shorthanded goal next year as well. And I wouldn’t be surprised if he got two on the penalty kill as his rate of shorthanded shots doubled last season, going from 0.07 per game to 0.15.

So taking a conservative approach and using his rate of shots and his individual shooting percentage from the last three seasons at even-strength and on special teams, we can expect Draisaitl to score about 50 goals in the 2022/23 regular season (27 on even-strength, 22 on the powerplay and one shorthanded). This of course is assuming Draisaitl remains healthy, he continues to play with good players at even-strength. And the Oilers powerplay continues to have the same talent and tactical approach as it’s had the last few seasons with Glen Gulutzan running things.

Now to get anywhere near 60 goals, a few things will need to go right.

First Draisaitl will need to match his career best shooting percentages at even-strength (20.53% in 2018/19) and the powerplay (25.81% in 2018/19). Doing that and generating the same rate of shots per game from the last three seasons (1.95 shots per game at even-strength and 1.17 shots per game on the powerplay) and he could potentially reach 57 goals (31 on even-strength, 24 on the powerplay and 2 shorthanded).

To get more than 57 goals, he’ll need to not only match his career high shooting percentages (as listed above), but also match his career highs in terms of shots per game at even-strength and the powerplay. If he can generate 2.14 shots per game at even-strength, which is what he posted in 2019/20, putting up 170 shots, and convert on 20.53% of those shots like he did in 2018/19, he could get to 35 even-strength goals. And if he can generate 1.41 shots per game on the powerplay like he did in 2020/21, put up 112 shots, and convert on 25.81% of those shots like he did in 2019/20, he could get to 29 powerplay goals. Add another shorthanded one, and he could get to 65.

Considering how well Draisaitl has played the last few seasons, how much time he gets to play with McDavid and how the rate of goal-scoring has increased across the league, it really isn’t out of the realm of possibility.

Data: Natural Stat Trick

Also posted at The Copper & Blue.

Wildnerness

It’s been pretty baffling watching the Jesse Puljujärvi situation play out in real-time. Part of me is annoyed that the club appears to be ignoring the positive on-ice impacts the 24 year old has had since being drafted. But I’m also well aware that this management group doesn’t always grasp what their team’s weaknesses are, has consistently had trouble identifying professional level talent, and very rarely makes well-informed roster decisions. This is an ongoing issue for the franchise, and doesn’t appear to be improving any time soon under the current ownership.

And let’s be very clear on Puljujärvi: his on-ice results (i.e., goal-share) and the shot-share metrics that predict future results all indicate he’s a top-six NHL winger who helps his team spend more time in the offensive zone and increases his team’s odds of out-scoring opponents. You can pick apart how he gets good results and his finishing ability – those are mostly valid. But there’s no question that his strengths have helped his teammates, especially his most common centerman and drives positive results for his team.

In an industry that’s still dominated by conservative, risk-averse individuals and flawed business practices and decision-making processes, he’s become an undervalued asset because of his size and the way he plays and how he’s personally produced. His deficiencies are being perceived to be greater than his strengths – basically a lot of noise that can be debunked with some progressive thinking and statistical analysis. There’s a lot of inefficiencies when it comes to roster construction and decision-making in the NHL, and this is a perfect one to exploit by an intelligent team.

Now I understand too that Puljujärvi’s group have probably recognized that the Oilers are not very deep on the right-side and might be asking for too much in negotiations, and that could be a reason why the Oilers prefer to move on from him. But this is why you need to identify talent as early on as possible through proper scouting and statistical analysis, and be willing to take on some risk by signing these players long-term earlier in their careers. “Over-ripening” isn’t an efficient approach in a cap world and the Oilers are now in a position of weakness in the trade market and at risk of losing a good player when his value is at its lowest.

The hope now is that the Oilers don’t get robbed in a trade, which has become a regular thing since Holland arrived. Whoever the replacement is for Puljujärvi, they need to be someone that can have a positive impact at even-strength, with and without top end linemates, and can be deployed against top competition. Based on the rumors out there, I’m not seeing any viable options unless the Oilers are planning to take on someone that’s a longer term project. The team has three seasons left with McDavid and Draisaitl to push for a championship, so whoever is acquired needs to make an immediate impact.

Related:

Data: Natural Stat Trick

Also posted at The Copper & Blue.

Previewing the Oilers vs Flames

With the second round about to start, a quick look at how all of the playoff teams performed up until this point. The table below has each team’s even-strength (5v5) shot-share numbers, goal-share, team shooting percentage and team save percentage from the first round, and is sorted by goal-share. I’ve also included each team’s special team numbers, which includes their rate of unblocked shot attempts for (Fenwicks) on the powerplay (PP FF/60) and their rate of goal-scoring per hour (PP GF/60). And also the rate of unblocked shot attempts against on the penalty kill (PK FA/60) and the rate of goals-against per hour (PK GA/60).

We know the Oilers did well in terms of shot-share metrics at even-strength (5v5) in their series against the Kings, thanks in large part to the play of McDavid. Aside from their inability to out-shoot and out-chance the Kings without McDavid on the ice, the team’s overal shooting percentage was also below what they had posted in the final twenty five games of the regular season (9.01%) – an indication that their other top line players are struggling or injured.

The other concern for Edmonton heading into their series against Calgary is that the Flames have performed quite well with and without their top line on the ice – both in the regular season and so far in the playoffs. In the last twenty five games of the regular season, the Flames top line featuring Johnny Gaudreau dominated at even-strength, posting some of the best shot share numbers in the league and a Goals For percentage of 68.29%. Without their top line, the Flames shot-share numbers were still excellent, and they out-scored opponents 34-30, a goal-share of 53%.

Flames (5v5)
Final 25

Corsi For% Fenwick For% Expected Goals For% Goals For% GF/GA
With Gaudreau 54.65 54.39 59.55 68.29 28/13
Without Gaudreau 58.97 57.97 52.52 53.13 34/30

The Flames shooting percentage took a major hit in the first round against the Stars thanks to a strong performance from goaltender Jake Oettinger. And that included the top line who saw their on-ice shooting percentage fall from 12.77% at the end of the regular season to 6.65% against Dallas in the first round. Similar issues for the team when the depth players took to the ice as their shooting percentage dropped from 6.88% in the regular season to 3.53% against the Stars. But as we see in the table below, the Flames continued to dominate the Stars when it came to controlling possession and scoring chances as reflected by their strong shot-share numbers. And the Oilers should probably expect the same in the 60-65% of 5v5 ice time when McDavid isn’t on the ice. The Flames have a more talented roster than the Kings, so it’ll be imperative that the Oilers depth players prevent as much bleeding as possible.

Flames (5v5) vs Dallas Corsi For% Fenwick For% Expected Goals For% Goals For% GF/GA
With Gaudreau 60.34 61.14 64.36 62.50 5/3
Without Gaudreau 60.41 58.70 57.00 50.00 5/5

Something else to monitor is the special teams.

While the Oilers penalty kill had outstanding results against the Kings allowing only 3 goals in 44 minutes (4.10 goals against per hour), they allowed one of the highest rates of shots and scoring chances against and relied on their goaltender to bail them out – an issue that’s carried over from the regular season. The Kings are a heavy shooting team as indicated by their rate of shot attempts in the regular season, so that might have inflated numbers. But knowing Smith’s past performance and injury issues, I’d be a little concerned if his work load remains high. And it’s something the Oilers should expect considering the Flames generated the third highest rate of shot attempts on the powerplay in the regular season, and they maintained those numbers in their series against the Stars.

Also worth noting that the Flames penalty kill in the regular season was excellent, as they allowed the third lowest rate of shots against in the league and the sixth lowest rate of goals against – and they peformed quite well against Dallas. The Oilers though appear to have the Flames number, as they scored 7 powerplay goals against them in the regular season – at a rate of 18.71 goals per hour.

Lastly, the goaltending.

Mike Smith posted solid numbers in the first round, posting a 93.70 save percentage and a +2.61 GSAA, third highest among the 17 goalies who played at least 100 5v5 minutes in the first round. The question now is if he can maintain these levels through another series, especially against a good possession team that can generate offence in waves and across more than one line.

Here’s how the Oilers team 5v5 save percentage, in rolling seven-game segmenets, looked in the regular season. I’ve added a blue line to show what the team’s save percentage has been so far in the playoffs.

What we see here is that the Oilers goaltending has shown spurts over seven game sets, but it’s typically regressed to league average levels soon after, which is what I would expect over the next series against a team like Calgary. Being league-average is still good and can win you games. It just won’t steal you some wins when the rest of the roster might be struggling. I have a feeling the Oilers will need that considering the injuries and the lack of production without McDavid on the ice. So hopefully Smith, or Koskinen if need-be, are up to the task.

Data: Natural Stat Trick

Also posted at The Copper & Blue.

Home ice disadvantage

Couple issues heading into game seven.

First, a quick look at how the Oilers have performed this series at even-strength (5v5) on home ice and on the road. They’re definitely getting better results on the road, and it’s a little concerning that their numbers aren’t as solid at home with their expected goal share being 46.60% and their actual goal-share being 38.46%.

We also know the Oilers are struggling in this series at even-strength (5v5) whenever McDavid isn’t on the ice. In their six games against Los Angeles, the Oilers have out-scored the Kings 9-4 with McDavid on the ice, but have been out-scored 8-5 without him. And that’s due in large part to their inability to control the flow of play and out-chance the Kings without McDavid, as the club has posted a Corsi For% of 47.35% and an Expected Goals For% of 44.67%.

What’s especially concerning is how poor the Oilers play at home without McDavid – not exactly what you’d want to hear heading into a game seven in Edmonton. In the three games at home this series, the Oilers without McDavid on the ice (about 65% of the team’s total 5v5 ice time) have scored only one goal at 5v5, and allowed six. Their underlying shot-share numbers have also seen a drop when they play in Edmonton, especially their Expected Goals For% which is 48.32% on the road but 39.97% at home.

There were three games this series where the Oilers posted an Expected Goals For% above 50% without McDavid on the ice – games 2, 3 and 6. Those were also the games that the Oilers won. No surprise that if the depth of the team is holding their own in terms of puck possession, shots and chances, the Oilers have a much better chance of winning games.

Compounding matters is the fact that Mike Smith has struggled at home as the Oilers 5v5 team save percentage at home is 89.33% – the worst among all playoff teams. Smith’s numbers have been significantly better on the road this series, with the 5v5 team save percentage ranking third overall with 95.60%. If the Oilers can spend more time with the puck and in the oppositions zone, it’ll definitely benefit Smith who has been fine this series, but not significantly better than Quick. The Kings team save percentage at 5v5 on the road is at 92.96% – fifth among all of the playoff teams.

Another look at the Oilers skaters at 5v5 at home, and sorted by their on-ice goal differential (i.e., Goals +/-). As noted last time, Draisaitl and Hyman have struggled in this series at even-strength as the Oilers tend to get out-shot and out-chanced with them on the ice. So it makes some sense to have Draisaitl play with McDavid. The problem is the Oilers already allow more chances than they can generate at home. And with the Oilers loading up their top lines, there’s plenty of opportunity now for the Kings to control the flow of play and exploit the depth players.

It’s also worth noting that Ceci and Keith have also seen their numbers take a slide when playing at home, and I wouldn’t be surprised to see the Kings continue targetting Keith’s side of the ice.

Anything can happen in game seven on Saturday night, but here’s hoping the Oilers coaching staff knows what their issues at even-strength are at home and can make the necessary adjustments to improve their odds of moving on to the second round. In game six, the solution was to play McDavid more often at 5v5, as the captain was on the ice for 42% of the team’s total ice time, an increase from 33% over the previous five games. It’s fair to expect the same on Saturday, and it’ll be interesting to see how the Kings coaching staff and players respond.

Data: Natural Stat Trick

Also posted at The Copper & Blue.

Pulse check

Quick evaluation of how things have gone for the Edmonton Oilers in their first four games of the playoffs. Two games at home, two on the road and a 240-minute sample size, let’s dig in. This should also be much more enjoyable than the last time I did a four-game playoff review of the Edmonton Oilers.

Let’s start with the good news:

  • The Oilers have two wins, outscoring the Kings 17-10 in all situations, and 10-7 at even-strength (5v5), a goal-share of 58.82%.
  • Their overall results at even-strength (5v5) are supported by solid shot-share numbers, with the Oilers controlling the flow of play as reflected by their 53.21% Corsi For percentage and generating a higher share of scoring chances – posting an Expected Goals For percentage of 56.64%. These are fairly consistent with how they ended the regular season.
  • The goaltending has been solid with the Oilers posting a team save percentage of 93.63% in all situations, ranking second in the league. Among 16 goalies who have played at least 80 minutes at even-strength (5v5), Smith ranks seventh with a 93.75% save percentage and fifth with a +1.55 goals-saved-above-average (GSAA).
  • The Oilers powerplay continues to be excellent, converting on 35.7% of their chances and scoring at a rate of over 13 goals per hour. They’re also generating over 60 shots per hour with the man-advantage, which is right around where they were in the regular season.
  • The penalty kill has also been very good, killing 93.3% of the Kings opportunities, allowing only one goal and scoring a shorthanded goal as well.
  • With McDavid on the ice at even-strength (5v5), the Oilers have completely dominated the Kings, posting a Corsi For percentage of 65.74%, an Expected Goals For percentage of 72.40% (!) and out-scoring the opposition 5-2 (a 71.43% goal-share). These are superhuman on-ice numbers and the Kings don’t appear to have a solution for him.

The things that might be of concern to the Edmonton Oilers:

  • While the team is breaking even in terms of goal-differential without McDavid on the ice at even-strength (5 GF, 5 GA) there’s a concerning drop off in the team’s overall play, especially defensively, as they’re getting outshot and out-chanced without their captain.
  • In about two hours of total 5v5 ice time without McDavid, about 67% of the team’s total ice time, the Oilers are spending more time without the puck and are allowing just over 40 shots against per hour – 10 shots higher than league average levels. Their current Expected Goals For percentage is closer to what the Oilers were posting when Tippett was coaching.
  • Looking at the on-ice numbers for forwards and defencemen this series, we see that the top line players are doing great, but most of the other players, including some of the top end forwards are having some issues. The table below is sorted by on-ice goal-differential and has a basic heat map applied to see how the players compare to one another.
  • One tandem in particular is Draisaitl and Hyman, who are both posting Corsi For percentages around 45% and expected goal shares even worse than that. As Dennis King mentioned on my show recently, the two of them did not post very good numbers on the road together during the regular season, indicating that they may be struggling when opponents have last change and can apply specific tactics. Since the coaching change, the two played 128 minutes together on the road, going -1 in goal differential (5 GF, 6 GA) posting an on-ice Corsi For percentage of 46.71% and an Expected Goals for perentage of 42.65%.
  • Not sure what the coaching staff is expecting from Archibald. He was dreadful in his limited minutes during the regular season and is only dragging down Nugent-Hopkins – who himself struggled in the last twenty five games of the regular season. If the Oilers want to make a deep run, they need three solid lines that control the flow of play and out-chance opponents. It’ll be interesting to see if Woodcroft and the coaching staff recognizes this and can make the necessary adjustments. Perhaps putting Nugent-Hopkins with Puljuarvi is the answer, as we know the Finn tends to have a positive influence on his linemates, especially on the defensive side of things.
  • The other issue facing the Oilers is the play of Jonathan Quick whose even-strength numbers (93.40 save percentage, +0.95 GSAA) are slightly above average and only slightly below Smith’s numbers in this series. As mentioned in my series preview post, Quick posted above-average numbers in the final twenty give games of the Kings season, and was getting breaks between starts, so it wouldn’t be surprising if he finishes with numbers similar to Smith.

Down to a best of three, we’ll see how it goes.

Data: Natural Stat TrickNHL.com

Also posted at The Copper & Blue.

Update: Here’s how the King’s skaters have done after four games.

Progress

One of the critical areas the Oilers have improved on since the coaching change has been the team’s results and supporting shot-share numbers without McDavid on the ice at even-strength (5v5). It’s been a regular issue since McDavid’s arrival in the NHL, as the Oilers are a standout team whenever he’s been on the ice, but are often getting caved in terms of shot-share, scoring chances and goal-differential without him. Year after year, management has failed to construct a roster that can hold their own without their captain, with coaching staffs making things worse by not trying out different line combinations, playing it safe and often loading up the top line with a combination of McDavid, Draisaitl and Nugent-Hopkins.

Here’s how the team has done without McDavid over the course of his career, with the Oilers not once being able to break even in terms of goal-share (grey bars). A big reason for that has been the poor goaltending and offensive finishing talent, with management unable to properly identify talent and efficiently manage their salary cap. But they were also losing the shot-share battle, spending more time without the puck and in their own zone – issues that should have been addressed with better on-ice tactics by previous coaching staffs.

Things were trending the same way this season while Tippett was behind the bench, as the Oilers were outscored 54-73 (a 42.54% goal-share) in the 1,400+ minutes without McDavid – roughly 66% of the team’s total time. And while the club did barely break even in-terms of shot attempts with a 50.17% Corsi For percentage without McDavid, they struggled to convert these into meaningful scoring chances, posting an Expected Goals for percentage of only 46.22%. These numbers were consistent with how the Oilers performed the last two seasons under Tippett, so it didn’t come as much of a surprise.

Since Woodcroft has been hired and able to implement his tactics, things have drastically improved when the Oilers are without McDavid at even-strength (5v5). The team’s shot-share numbers have seen a slight bump and their expected goal share has improved by over four percentage points reaching the 50% mark thanks to their reduction in shots and scoring chances against. And more importantly, the Oilers are now posting a positive goal-differential for the first time since McDavid’s arrival. Goaltending has obviously been better as well, and hopefully it continues. But it’s clear the tactics Woodcroft has implemented, including his reluctance to sit back and protect any leads like his predecessors often did, are working as reflected by the shot-share and scoring chance numbers.

This is a positive development for a team that couldn’t really be considered a championship contender the last two seasons because of the lack of depth offence and scoring, and a coaching staff that was too risk averse with so many blind spots. With the team rolling the way it is and actually outscoring opponents without McDavid on the ice, there’s a good chance they can at least win a couple playoff games. And depending on how the goaltending holds up, maybe even a series.

Data: Natural Stat Trick

Also posted at The Copper & Blue.

Comparing Woodcroft to the previous Oiler coaches

Pretty remarkable turnaround for the Oilers since the coaching change, with the Oilers now winning 21 of the 32 games with Jay Woodcroft behind the bench. The data after the first ten games indicated the early results under Woodcroft were sustainable – we just didn’t know if the team would stay healthy and if the goaltending would hold up. Thankfully for the club and their playoff aspirations, everything has gone really well.

The even-strength (5v5) results since Woodcroft took over is the key driver right now, with the Oilers doing an excellent job controlling the flow of play (as reflected by the shot-share numbers), consistently pushing for offence even when leading the game, and just dominating opponents on the score sheet. Goal-differential at five-on-five is an important metric for Holland, so it should be obvious to him how significant the results have been since Tippett was dismissed.

The Oilers under Woodcroft have been getting much better goaltending with the team’s save percentage closer to league average levels, and have also seen their team shooting percentage improve. But they’re also getting a higher share of the total scoring chances, as reflected by the expected goals for percentage, due in large part to the coaching staff’s tactics. This includes changing how players are deployed, how they play in the neutral zone, looking for more favorable line match-ups and pushing for offence regardless of the score.

And relative to the previous coaches in the McDavid era, Woodcroft is doing really well with the roster he’s been given and should strongly be considered for a new contract.

This is the first time since 2016/17 that the Oilers have posted a positive goal differential at even-strength – something the Oilers couldn’t achieve under Holland’s first coaching hire (and someone the general manager actually wanted to extend just prior to dismissing him). And this is the first time the Oilers are posting underlying shot share numbers that are better than just break-even and closer in line to what the top teams in the league post (i.e., teams that have a points percentage above 0.600 in the regular season). A 54% Corsi For percentage and Expected Goals For percentage is what top end teams like Florida, Calgary, Carolina, Boston, Toronto and Colorado are currently posting. The Oilers are closer to that group thanks to the coaching change, and should expect to continue doing well if they stay healthy and get decent goaltending.

Now it’s understandable if management wants to wait for the off-season to make the call on whether or not Woodcroft should be given a new contract. Maybe it’s in Woodcroft’s best interest too in case another team brings forward a better offer. But it’s difficult to envision a scenario that would disqualify Woodcroft’s candidacy to be the head coach in Edmonton next season. The regular season results have been excellent and far better than what they’ve had since McDavid arrived seven years ago. And it’s not really reasonable to base the coaching decision on what happens in the post-season considering the playoff tournament is highly volatile that could go either way in a series – really depending more on which team gets the better goaltending. And if the players and their agents are already signing off on having Woodcroft stick around, it’s difficult to go another direction.

It’ll be interesting to see what approach the Oilers take, either going with someone they know and have developed as a coach, someone who appears to have progressive ideas and knows the players and prospects well. Or do they go with an external option, likely someone with similar traits to the previous three coaches. Just keep your expectations of the team lower if that ends up being the case.

Data: Natural Stat Trick

Related:

Also posted at The Copper & Blue.

Protecting leads

A common trend we’ve seen across the league for many years now is how coaches alter their approach depending on what the score is in a game. Trailing in a game, and you can expect the coach to start playing the skilled players a little more and be willing to take on some more risks to create offensive chances. Leading in a game, and teams start to play more conservatively, not really trying anything that could lead to a turn over, and focus more on just keeping the puck out of their own zone.

And we can see this in the data from the previous three seasons. Using Corsi For percentage as a proxy for puck possession, we see how when the game is tied, team’s on average control about 50% of the total shot attempts for and against. When trailing in a game and looking for the next goal, we see that the league average Corsi For% jump to 55%. And when they’re leading, teams tend to take their foot off the gas, not trying to create too much, and we see the league average Corsi For% drop to around 45%. In the graph below, these league-average levels are indicated by the orange line. And for context, I also added the league-high (blue line) and league-low (grey line) Corsi For% for each game-state to show the range.

Protecting the lead

The way coaches approach things when their team is leading in a game isn’t all too suprising considering the majority of them are fairly risk-averse. And they would rather their players play a simple game and not do anything that could jeoparidize their lead. What’s interesting is that in his first fourteen games as head coach of the Edmonton Oilers, Jay Woodcroft seems to have a different approach and appears to be pushing his team to continue generating offence even with a lead. A stark contrast to the previous three head coaches the Oilers have had since 2015.

The table below has the same three lines as the previous graph showing the range of Corsi For% across the league when a team is leading in a game, tied or trailing. Added to the graph now are bars to represent the previous coaches the Oilers have had and what the Oilers Corsi For% was under them in different game states.

What we see here is that when Todd McLellan, Ken Hitchock or Dave Tippett were coaching, the Oilers followed the usual trend. They would push for offence at a league average rate only when trailing in a game, and saw a significant drop in their puck posession numbers when leading in a game. Hitchcock especially had the Oilers pretty much playing in a defensive shell posting some of the lowest posession numbers in the league when the score was tied or when the Oilers were leading.

What stands out here are the Oilers numbers when they’ve been leading in games under Jay Woodcroft. While the average team posts a Corsi For% of 45% when leading the score, the Oilers are posting one of the highest possesion numbers in the league with 54%. They appear to be pushing for offence, opting to control the flow of play and put pressure on opponents as a way to stifle any chances against. It’s a riskier way to play, but makes sense considering it’s what the top teams in the league do. This season, eight of the top ten teams in terms of Corsi For% when leading have a points percentage above 0.600, and includes Florida, Calgary and Colorado at the top.

I’d be curious to hear Woodcroft’s thoughts on the matter and if he does have a different perspective on how best to protect leads, especially with so many critical games coming up. And if this changes the type of players Holland and his scouting staff start targeting in the off-season.

Data: Natural Stat Trick

Also posted at The Copper & Blue.

Related: Chasing the game – The SuperFan (2020, January 3)

Digging into the Oilers special teams

The Edmonton Oiler’s special teams has become a drag this season, something I don’t think fans were expecting considering how much of a positive impact it has had on the overall results over the previous two seasons.

When you combine the goals for and against on the powerplay and the penalty kill this season, the Oilers special teams has posted a -1 goal differential, which is right around league average. That’s a significant drop from last season when the Oilers special teams posted a +19 goal differential, the highest in the league. The year before that, their special teams was +21 and tied for first in the league. Without a doubt, the Oilers special teams is the reason why they finished second in their division in 2019/20 and 2021, considering how poor their even-strength (5v5) goal-differential was in both of those seasons (-16 in 2019/20 and -1 in 2020/21). Since the Oilers full-season goal differential at even-strength (while improving under Woodcroft) is still poor sitting at -5, they desperately need their special teams to be better than league average if they have any hopes of clinching a playoff spot.

Penalty kill

The Oilers are currently allowing the sixth highest rate of goals against in the league on the penalty kill (8.91 per hour) and only ahead of Detroit, Montreal, Arizona, Seattle and Vancouver. And this is largely due to their goaltending which has posted a 84.53% save percentage that ranks 26th overall.

The Oilers have actually done a decent job in front of their goaltending, allowing a near-average rate of shot attempts and shots on goal against. And these numbers have gradually been improving. Under Dave Tippett, the Oilers allowed 58.47 shots against per hour, slightly higher than the league average rate of 54.67. Under Woodcroft, the Oilers are now allowing 55.38 per hour.

The problem is the goaltending has consistently been poor this season. Koskinen has an 84.50% save percentage, ranking 47th among 62 goalies who have played at least 50 minutes, while Smith ranks 56th with an 82.1% save percenatge. While both goalies did post solid penalty kill save percentages over the previous two seasons, Oilers management should have expected an eventual drop-off considering the age of both netminders and the increased potential for injuries and the extended recovery times necessary. Unfortunately, this is what happens when managers lack an understanding of player-aging-curves and fail to address key issues in the off-season.

Powerplay

Over the full season, the Oilers powerplay has scored at a rate of 9.44 goals per hour, ranking fifth in the league and just slightly below the rate of goals they scored over the previous two seasons, leading the league with 10.60 per hour. The Oilers had a great start to the season but have since been in a steady decline with the Oilers generating only 6.41 goals per hour since Woodcroft was hired – one of the lowest rates in the league. The graph below breaks out the Oilers season into rolling 25-game segments and shows the rate of powerplay goals per hour, with the vertical line indicating when the coaching change occurred.

A big reason why the Oilers powerplay has dropped off is their declining rate of shots and scoring chances. Prior to the coaching change, the Oilers were generating over 69 shots per hour – the highest in the league and well above the league average rate of 54.66 per hour. But since Woodcroft’s arrival, the rate of shots has dropped down by 29.5% falling to 48.64 per hour.

The issue here is that the Oilers are really missing Ryan Nugent-Hopkins.

The Oilers have historically seen their rate of shots on the powerplay drop whenever Nugent-Hopkins isn’t on the ice, and that’s even with McDavid and Draisaitl on the ice. Over the previous two seasons, McDavid and Draisaitl have played 52 minutes without Nugent-Hopkins with them and saw their on-ice rate of shots-for drop by 23.8% – going from 64 shots per hour when the trio is together to 49 shots per hour without Nugent-Hopkins.

The same drop-off has occurred this year with the rate of powerplay shots dropping by 16.3% when McDavid and Draisaitl haven’t had Nugent-Hopkins with them, going from 71 shots per hour down to 60. Nugent-Hopkins has missed 11 games this year, and in the 100 powerplay minutes the Oilers have played without him the team has seen a major drop in productivity scoring at a rate of 6.54 goals per hour – a stark decline from the 11.28 goals per hour the Oilers have scored when he’s been on the ice.

While the Oilers can’t predict when injuries will hit, they should be aware of the fact that Nugent-Hopkins is starting to creep into the tail end of his career, having played 701 NHL games now and becoming more susceptible to injuries. And they should also be aware of the positive impact he’s historically had on the powerplay and planned on what to do if they’re ever without their powerplay witch. Again this comes down to management’s ability to regularly analyze their on-ice results, conduct sound player evaluation and intergrate as much information as possible into their decision-making process. The powerplay can still be fixed, but Ken Holland and his staff are once again taking a reactive approach instead of proactively trying to get ahead of issues before they come up and derail a season.

If the special teams is what costs the Oilers a playoff spot, management will have only themselves to blame.

Data: Natural Stat Trick

Also posted at The Copper and Blue.