The Edmonton Oilers announced several front office changes today, including the addition of three new assistant general managers. There appears to be a bigger focus on the European market, player procurement, player development and innovation. As well as continued expansion of their analytics and technology department. The full news release is on the Oilers website.
These changes also tie well well into what I wrote about last week around strengthening the foundational pieces of the organization and the key strategies and enablers needed to keep the Oilers championship window open.
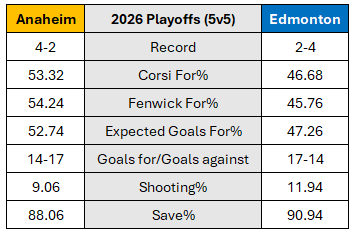
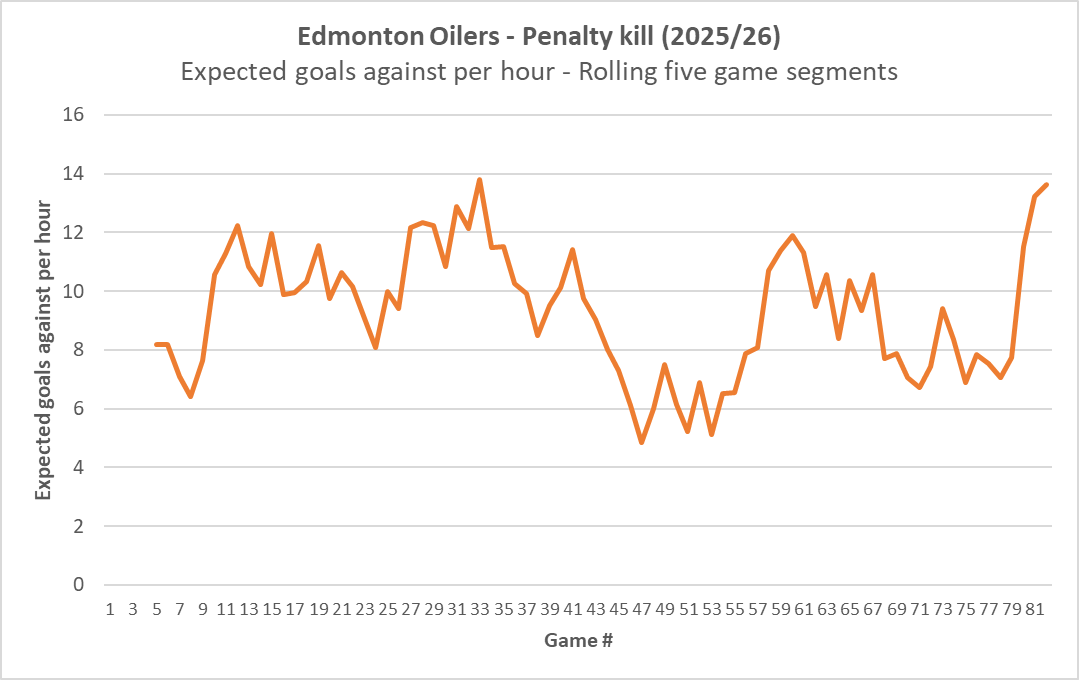
Every single issue the Oilers have – from goaltending, to team defence to poor roster construction to the penalty kill, etc. – these are all symptoms of much deeper systemic issues. Specifically, the issues around how the Oilers draft, develop, derisk and deploy players. And the organizational enablers for these strategies – the people, the technology and especially the governance around how decisions are made – these haven’t been great either. These core deficiencies contributed to a disappointing regular season and playoff run – and the changes today reflect an acknowledgement of that.
Oilers GM Stan Bowman also shared his thoughts on Oilers Now with Bob Stauffer shortly after the announcement and it’s worth a listen. Giving a rundown of the changes, Bowman did speak very highly of Michael Parkatti and his team and how the organization uses the tools and information that have been developed in-house. Good sign that the enablers are being strengthened and the growing influence of analytics. But Bowman did add this line, which caught my attention.
“The analytics alone are not the answer but scouting alone isn’t the answer either. You’ve got to blend them together. The more you can do that effectively, the more good decisions you’re going to make.”
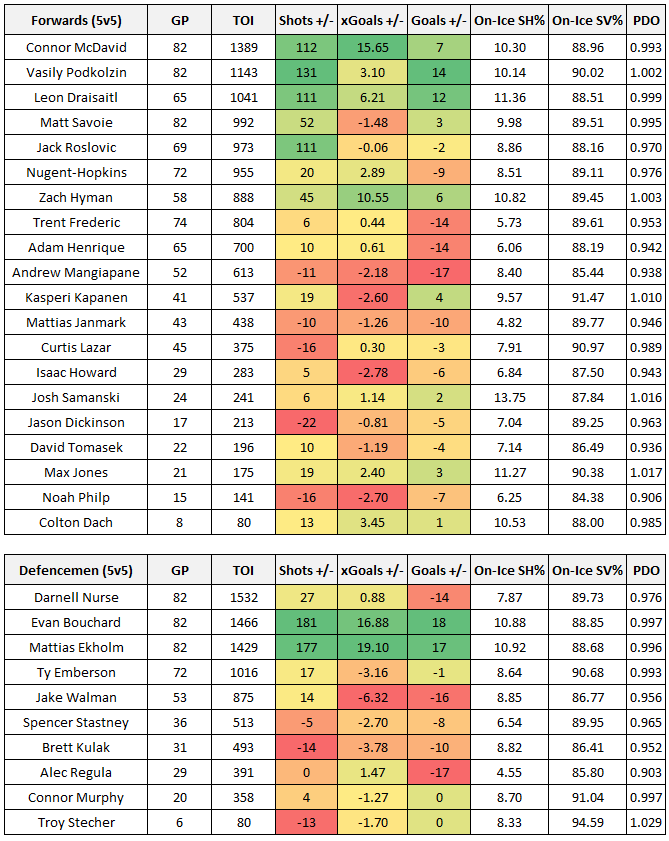
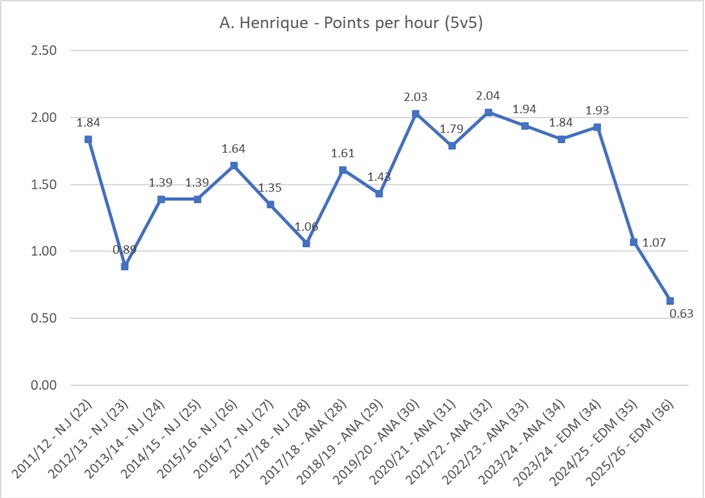
No argument with the concept. Your decision-making process has to leverage as much information as possible. But it’s something I think Bowman is struggling with just based on some of the poor roster-construction decisions he’s made since arriving in Edmonton. The Jarry acquisition, the Trent Frederic extension, how the Blues offer-sheets went down – all of these decisions don’t appear to be grounded in data or more modern, deeper insights. These decisions among others all have a “gut-feel”, eye-test vibe to it and is something that the Oilers could eliminate with better decision-making governance.
It’s also critical that the Oilers look to strengthen their pro scouting team by adding people who have that eye for the game and evaluating player attributes, but also have a demonstrated understanding and appreciation of how data analytics fits into hockey analysis. Someone who can bridge the gap between, or blend them like Bowman mentioned today, to drive deeper collaboration between the two areas, eliminate biases, and to help drive insights for better decision-making.
And if this person has experience working as a pro scout in the NHL, maybe for a smart front office, like Carolina. Or has a history of demonstrating their deep knowledge of the Edmonton Oilers online using video breakdowns, or have been on my podcast. Probably worth giving them a call. Dennis King and Bruce Curlock were the first names that came to mind, yes, but I’m sure there are others.
If the Oilers are serious in wanting to blend analytics and pro scouting, it’s really not that hard to resolve.
Update:
Wanted to share some of the responses I’ve received after this article was posted.
Here’s what David Johnson posted on BlueSky. David has experience working in the NHL, and shared some great perspective on how scouting and analytics works in a front office.
- “Integration of scouting and analytics has to come from the top. It can’t be delegated. If the top management doesn’t buy in to analytics it just won’t work no matter how many analytically inclined scouts you have.
- The way to integrate scouting and analytics is the same way as integrating a new scout. Scouts don’t agree on everything. Think of disagreement as adding uncertainty to player evaluation. How upper management handles that additional uncertainty is critical.
- Where do the scouts agree? Where do they disagree? Is where they disagree important to us? How does this impact the price we are willing to pay for the player (salary, acquisition cost)? Those are the questions upper management must ask when there is disagreement among scouts.
- Now you bring yet another opinion, analytics, to the table. Analytics will agree with the scouts on many things, but will disagree on others. It doesn’t matter as much who is voicing those analytical opinions as much as whether upper management trusts that opinion.
- Maybe an analytically inclined scout can better communicate analytic driven evaluations to other ‘hockey people’ and maybe that scout can better build trust but a lot of it comes more down to personality, experience and track record. Trust isn’t earned over night.
- You need two things to build trust. First, an upper management team that is open minded and willing to listen to their analytics groups evaluations and an analytics group that is capable of earning that trust through good work, good communication and showing some ‘wins’. It takes time.”