One last check-in on the western conference before the 2024 NHL playoffs begin next week.
The Oilers finished second in the Pacific division and fifth in the west, going 14-7-4 in their last twenty-five games of the regular season. They’re easily one of the top teams in the league, but they have a lot of strong competition – especially in the west. All eight teams have a case for winning their opening round series, and there doesn’t appear to be any easy paths to the finals.

Couple reasons for optimism.
The Oilers have consistently posted some of the best shot-share numbers in the league, ranking highly when it comes to the rate of generating shots and scoring chances as well as preventing them. I think that’s something that tends to get overlooked because of their high-end offence. The Oilers have over the course of the full season been a pretty solid defensive team, posting some of the lowest rates of shots and scoring chances against, and doing everything they can to help their goaltending.
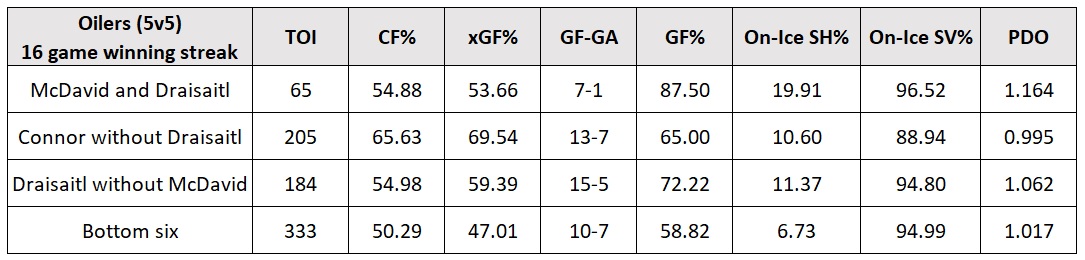
The Oilers actual results have been very good. Their +57 goal differential (all situations) was fifth best in the league, and third in the western conference only behind Dallas (+64) and Winnipeg (+60). Their 55.78 percent goal-share (+40 goal differential) at even-strength (5v5) was fifth best in the league, and driven largely by their 55.52 percent Corsi For percentage and finishing talent at the top of their roster. Worth noting that while the Oilers did a good job controlling the flow of play and scoring chances without McDavid or Draisaitl on the ice, they couldn’t consistently convert on their chances and posted a -3 goal differential. The lack of finishing talent has been a problem all season, and wasn’t addressed by management.
The one area that could (again) be an issue is goaltending. It’s been a great story this year with Stuart Skinner, and how he’s solidified himself as a legit starter with Campbell being demoted to the minors. But the team’s 89.77 percent save percentage (all situations) finished 17th in the league and 9th in the western conference. Among the eight teams from the west that have qualified for the playoffs, their save percentage is only slightly better than Colorado’s (89.70 percent). It could be good enough for the playoffs, but I don’t expect the Oilers goaltending to win the team any games when games get tighter.
The other issue is Skinner’s workload this season, which has been one of the highest in the league. Only four other goalies played more minutes than him, which is a serious concern that I wrote about back in January. Ideally, you have a tandem in net to keep both goaltenders fresh for the playoffs. Unfortunately, the Oilers didn’t address this situation, and are at serious risk of performing poorly at such an important position.
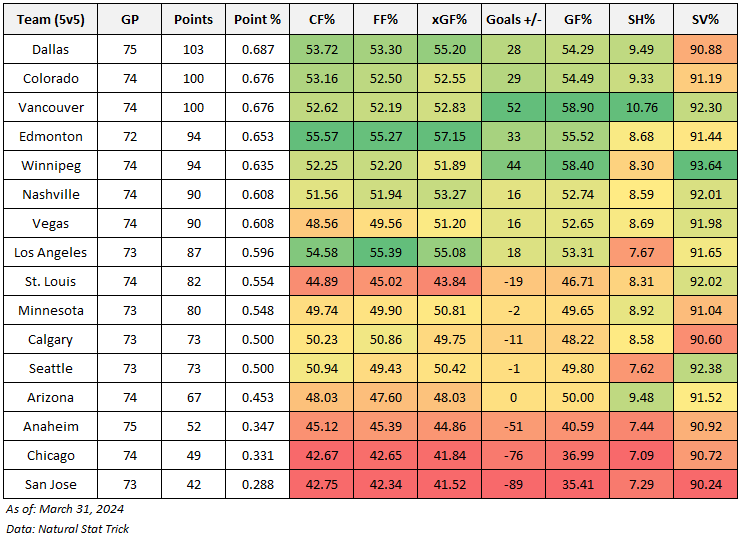
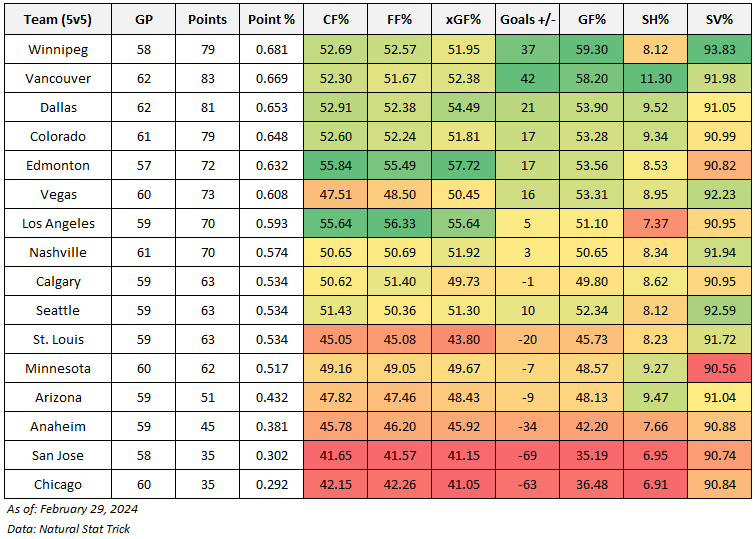
Quick glance into how each western conference has performed at even-strength over their last twenty five games (since around mid-February). Helps give a sense of what each team’s strengths and weaknesses are and how it could translate into their post-season results.
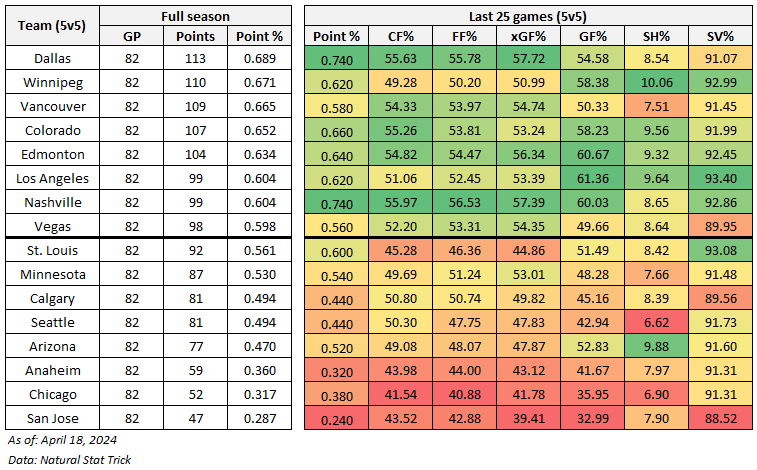
Nashville really stands out here. They might have finished the season in the first wild card spot, but they finished the season on a high note. They posted a 0.740 points percentage in their last twenty give games, driven largely by their strong shot-share and expected goal numbers, as well as their goaltending. Vancouver on the other hand had really regressed, coming close to losing their grip on the Pacific division title to Edmonton. They’re having trouble scoring goals recently, which is a little concerning since they’re going up against Nashville in the first round.
Vegas didn’t have a great finish to the season either, and their goaltending was one of the worst in the league. But with players coming back from injury, and the fact that they’re doing a good job controlling the flow of play and scoring chances indicates that they should be competitive in the first round. Dallas is the one team that’s been good all season long, and could be the team to beat in the west.
Data: Natural Stat Trick