Disappointing results for a team that had such high aspirations. Following a regular season where they finished second in the division and had three 100-point players, the Oilers were eliminated by a team that picked them apart a few different ways and had the better goaltending. And it’s not like Vegas was any sort of daunting juggernaut. With a deeper roster, and some better coaching decisions, the Oilers could have been in the western conference finals.
| Edmonton Oilers | 5v5 | Vegas Golden Knights |
| 55.65 | Corsi For% | 44.35 |
| 54.29 | Fenwick For% | 45.71 |
| 53.50 | Expected Goals For% | 46.50 |
| 37.50 | Goals For% | 62.50 |
| 9-15 | GF-GA | 15-9 |
| 6.60 | Shooting% | 12.35 |
| 87.65 | Save% | 93.40 |
| 0.942 | PDO | 1.058 |
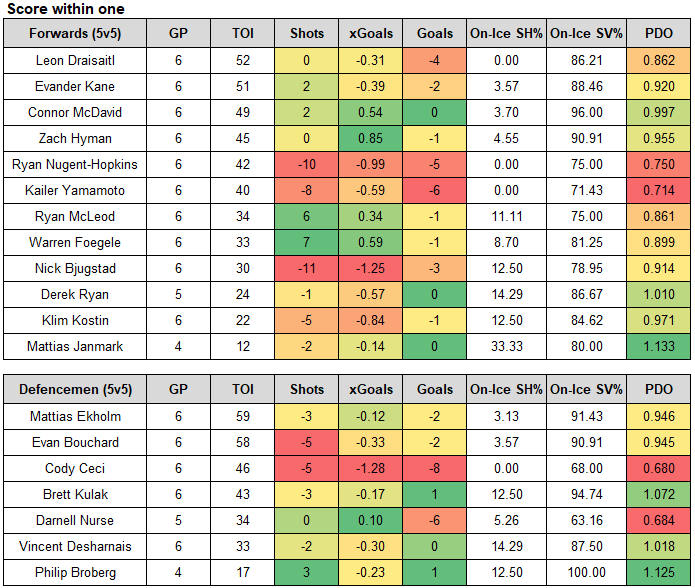
When it comes to the performance numbers at even-strength (5v5), the Oilers did post better shot-share numbers than Vegas. But it was largely boosted because they trailed so often in games, allowing score-effects to creep in. When the score was ever within one goal (144 minutes, or about 52% of the total time against Vegas in the series), the Oilers posted a Corsi For percentage of 52% and an Expected Goals For percentage of only 46%. So when both teams were pushing for offence and defending their own zone, and deploying more of their depth players, Vegas was the one getting the higher share of quality chances.
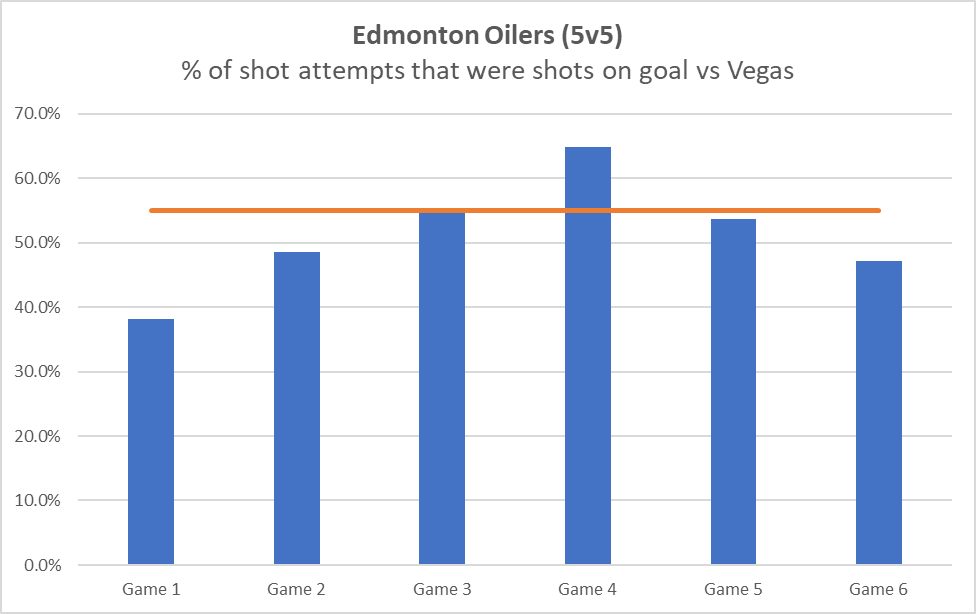
What Vegas did really well was limit the Oilers chances to lower probability scoring areas, something the Oilers were slowing getting better at as the series progressed. But after game four when it came down to a best-of-three series things fell apart again. The table below breaks down the Oiler’s proportion of shot attempts at even-strength that were actual shots on goal by game. The orange line indicates the Oilers regular season average.
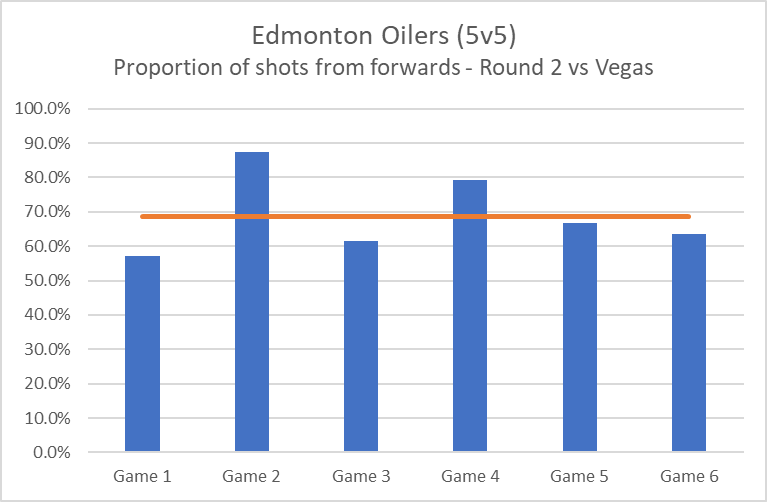
The other issue I had been tracking was how often the shots the Oilers were taking were coming from the sticks of forwards, who are typically in higher danger areas and have better odds of scoring goals than defenceman. During the regular season, 68.7% of the Oilers shots were from their forwards. But in their series against Vegas, the Oilers had trouble reaching this level, as we saw a lot more point shots from defenceman. In games two and four is when the Oilers forwards got the most opportunities, which is also the games that they won in the series.
And here’s an updated summary of the Oilers skaters and their on-ice numbers at even-strength, sorted by time-on-ice (TOI). Key thing here is that most of the top-end players did well, as the Oilers typically outshot Vegas with them on the ice. But when Kane, Nugent-Hopkins, Bjugstad or Yamamoto were on the ice, the Oilers were typically playing without the puck and in their own zone. An issue that the Golden Knights coaching staff recognized and ensured the deployment of Eichel’s line when they were on the ice.
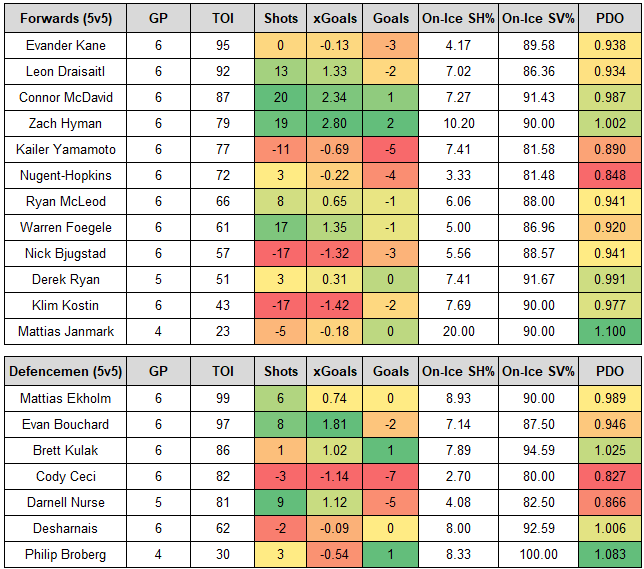
I was surprised to see that McLeod didn’t get as much ice time at even-strength, considering how well he’s played in the post-season and his head-to-head numbers against some of Vegas’ top performers. For example, in about 18 minutes against Eichel (about 27% of his total ice time), McLeod’s on-ice Corsi For percentage was 66.7%, and the team outshot Vegas 14-6. That’s on the coaching staff for not recognizing his performance numbers and perhaps only looking at goal differential, which doesn’t always reflect a players true value.
As for goaltending, it’s obvious Vegas had the edge in the series. They posted the second highest even-strength save percentage (94.83%) among first round teams, shutting down the Jets. And they did it again in the second round (93.40%), albeit with a different goalie. Maybe that’s the key – having two good goalies to share the workload in case one of them was overworked in the regular season, and could be susceptible to burnout or injury.
The other player that stood out this series was Bouchard, who I thought performed well and had great results. He made some mistakes, but I thought the good outweighed the bad. The concern I would have with his play against Vegas is that when the games were close (looking at when the score was within one goal), he posted some of the worst on-ice numbers among the Oilers defencemen.
When the Oilers trailed by a couple goals, and Vegas would be more risk-averse, that’s when Bouchard’s numbers were stronger. I’d still think very highly of Bouchard and hope that the Oilers sign him to a longer term deal. I would just be leery of his on-ice shot share numbers and point totals, as there does appear to be some things he’ll need to work on.
And he’s definitely not the only one. Nugent-Hopkins was another player whose numbers took a hit when the game score was within one. Something that falls more on the coaching staff who tried to run him as a center to drive his own line, when we’ve known for a while now that he’s more of a complementary player. Ceci is another player who struggled in all situations, which really falls on Holland who signed him to a long-term contract that aligned with the McDavid/Draisaitl window. Improvements need to be made across the roster right away here if the Oilers intend on a deeper playoff run next season.
Data: Natural Stat Trick
Related:
- In the cards – The SuperFan (2023, May 11)
- Shots from defencemen – The SuperFan (2023, May 9)
- Previewing the Oilers vs Golden Knights (2023) – The SuperFan (2023, May 2)
- Series Stories: Vegas vs Edmonton – All Three Zones (2023, May 18)
- The Edmonton Oilers v. The Vegas Golden Knights Game 6: A Tactical Review – OilersNation (2023, May 16)

Pingback: Reviewing the Edmonton Oilers trade deadline | The SuperFan