After their overtime win against St. Louis, the Oilers have now accumulated 83 points in 69 games – holding down second place in the Pacific in terms of points percentage (0.601), just barely ahead of Los Angeles.
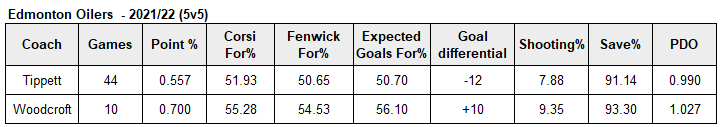
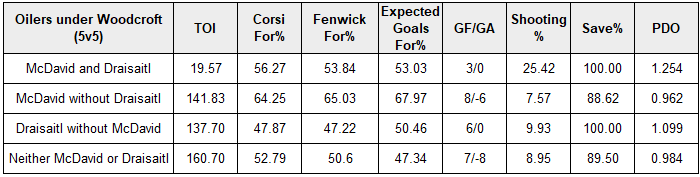
The team has been excellent since Jay Woodcroft replaced Dave Tippett behind the bench, with the team going 16-7-2 in 25 games, posting a points percentage of 0.680 and out-scoring opponents 99-78 in all situations. What’s especially encouraging is how strong the results have been at even-strength, with the team posting a goal-share of 54.78% (63 goals for, 52 goals against) in those 25 games. And those results appear to be sustainable as the Oilers have posted a Corsi For% and Expected Goals For% above 54% in that stretch. This is a significant improvement from the results under Tippett, as the club never posted a positive goal-differential at even-strength and had shot-share numbers closer to league-average levels.
What’s especially encouraging about the Oilers results under Woodcroft is how well the numbers compare against the top teams in the league.
The table below sorts the western conference teams by their full-season points percentage, with Colorado, Calgary and Minnesota leading the way and Edmonton ranking sixth. I’ve also included each team’s even-strength (5v5) results over their last 25 games as reflected by their goals for percentage (GF%), as well as the underlying shot-share metrics such as Corsi For% to measure how well the Oilers as a team control the flow of play, as well as Fenwick For% and Expected Goals For% to gauge how well they control the overall share of scoring chances. Team shooting percentage and team save percentage has also been included to capture the player-driven factors that may be impacting the overall results. A glossary can be found at the end of this article.
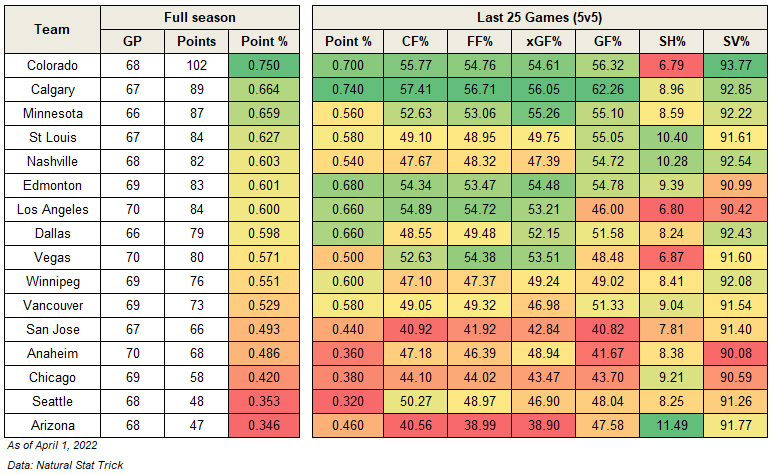
What we see here is that Edmonton has been one of the best teams in the western conference since Woodcroft’s arrival (lots of green boxes), posting one of the best goal-shares in the league and underlying shot-share numbers that are close to what the other top teams have posted. Their issue remains goaltending which ranks poorly relative to the rest of the conference, and 26th in the league. Knowing how important goaltending is in the playoffs, it’s definitely a spot of bother – especially when you consider how much talent the Oilers have up front and the pressure on the franchise to win.
Worth noting too which clubs haven’t been so strong at controlling the flow of play and scoring chances recently, specifically St. Louis and Nashville, and if they might struggle in the playoffs – although Nashville has the goaltending to overcome their issues. Vegas is another team to watch as they have solid underlying numbers relative to the conference, but aren’t converting on their chances and getting mediocre goaltending.
The Oilers are in a good spot right now with a points percentage above 0.600 and appear to have the talent up front and coaching tactics to be a competitive team down the stretch. If anything causes them to drop in the standings, it’ll be the goaltending which Ken Holland has expressed his confidence in many times – most recently at the trade deadline.
Data: Natural Stat Trick
Glossary:
- Points-percentage (Point%) – The total points accumulated divided by the points that were available, including extra time.
- Corsi For percentage (CF%) – The proportion of all the shot attempts the team generated and allowed that the team generated (i.e., Corsi For/(Corsi For + Corsi Against). This is used as a proxy for possession and is the best at predicting a team’s future share of goals (GF%). (Source: Hockey Great Tapes – Draglikepull)
- Fenwick For percentage (FF%) – The proportion of all the unblocked shot attempts the team generated and allowed that the team generated (i.e., Fenwick For/(Fenwick For + Fenwick Against). This is used as a proxy for shot quality and considers shot blocking a repeatable skill.
- Expected Goals For percentage (xGF%) – This is a weighting placed on every unblocked shot based on the probability of the shot becoming a goal. This depends on the type of shot, location and uses historical shot and goals data to come up with the probability for each unblocked shot.
- Goals For percentage (GF%) – The proportion of all the goals that the team scored and allowed that the team generated (i.e., Goals For/(Goals For + Goals Against).
- Shooting percentage (SH%) – The percentage of the team’s shots on goal that became goals (i.e., total goals divided by the total shots on goal).
- Save percentage (SV%) – The percentage of the team’s shots on goal against that were saved (i.e., 1-(totals goals allowed divided by the total shots on goal against).
:no_upscale()/cdn.vox-cdn.com/uploads/chorus_asset/file/23308666/GameStateCF.png)
:no_upscale()/cdn.vox-cdn.com/uploads/chorus_asset/file/23308719/GameStateCF___EO_history.png)